Work

Cancer Will Lose

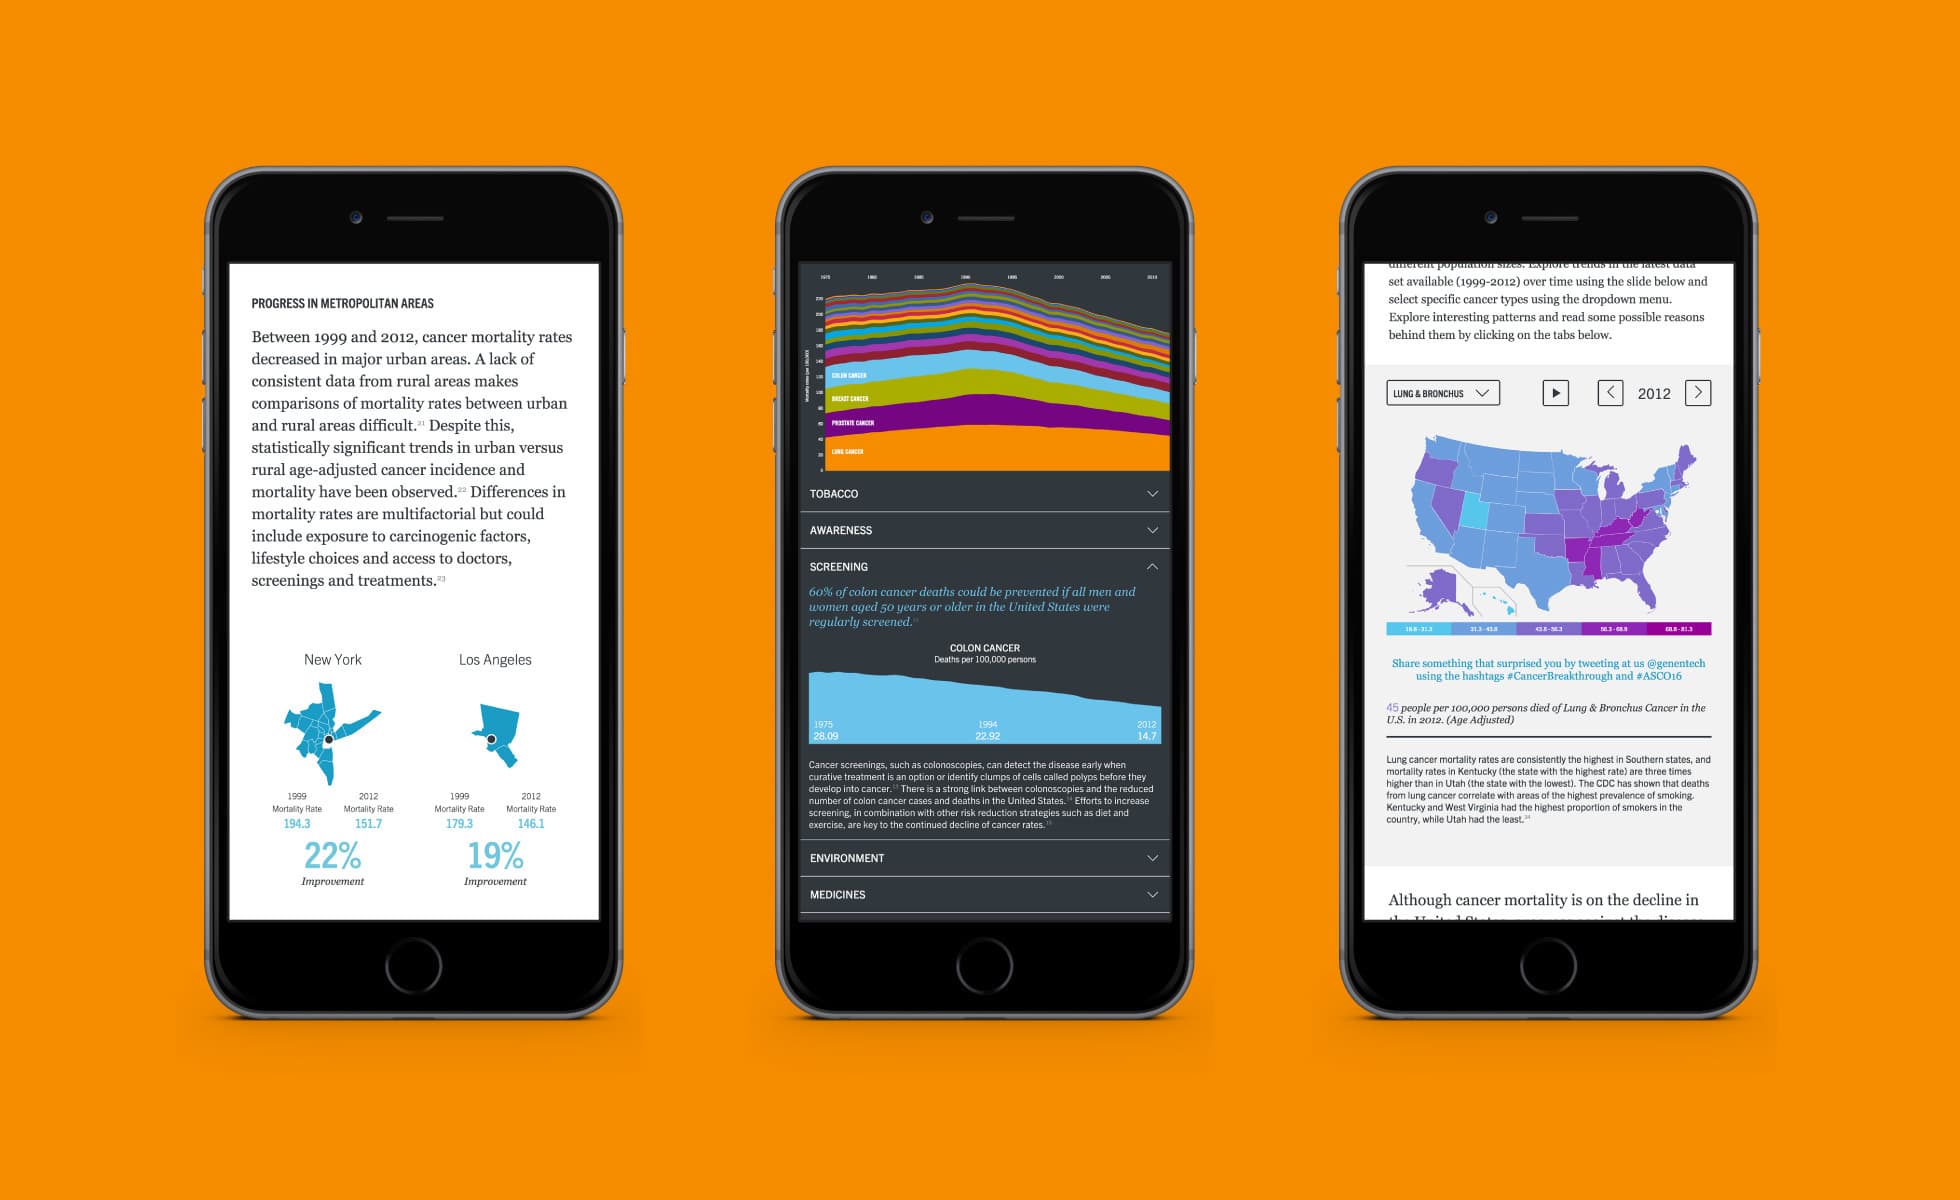
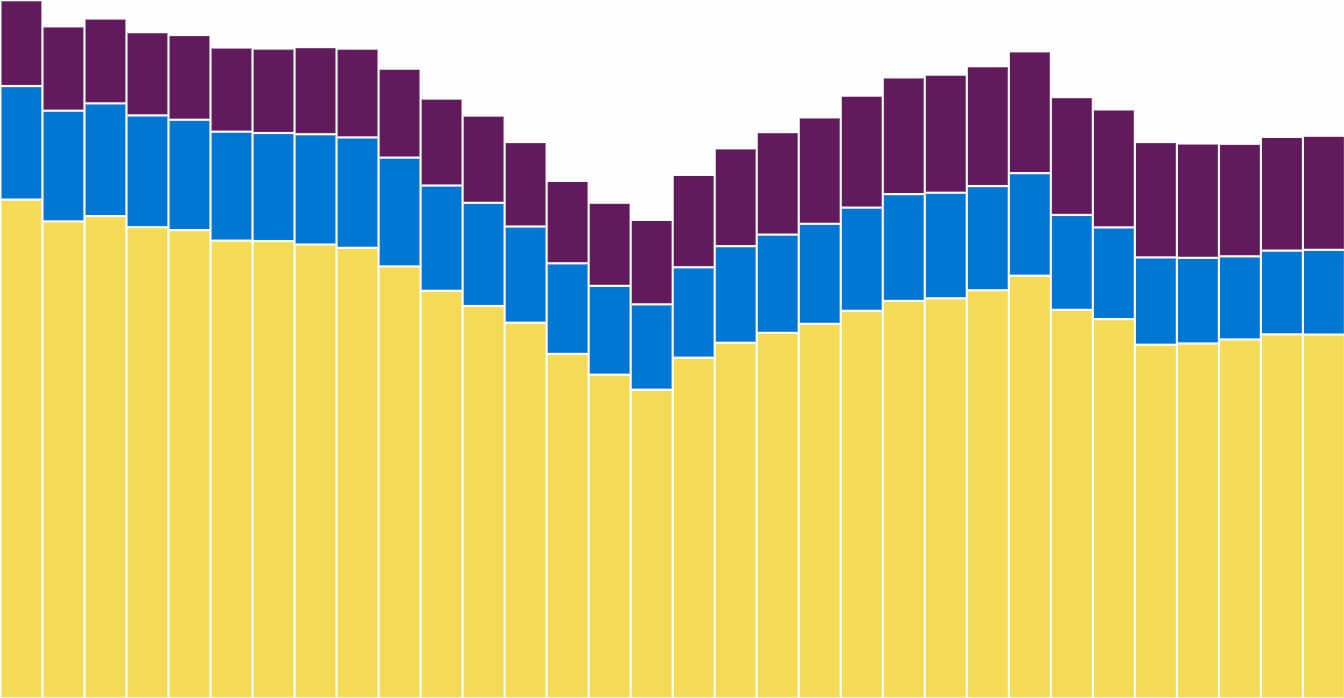
Cancer will claim 600,000 American lives in 2016 alone, but the tide is turning.

An image showing a desktop computer, tablet, and smartphone displaying various screens from a website. The desktop screen shows the message "CANCER WILL LOSE," the tablet displays a colorful data graph, and the smartphone shows a webpage titled "CANCER IN AMERICA.

In an effort to help elevate the story behind cancer breakthroughs and the future landscape, we teamed up with Genentech to create a digital storytelling piece. Genentech advances technologies that make medicines to address unmet medical needs, and help millions of people worldwide, including those affected by cancer.

“Cancer Will Lose” is divided into three chapters covering the state of cancer in America, highlighting achievements in the fight against cancer over the last 40 years and setting the stage for the next frontier: Immunotherapy. Using datasets made available by the U.S. Centers for Disease Control and Prevention, we visualize the rise and fall of Cancer mortality rates over the last 40 years. Mortality rates of the most prominent cancers are also mapped by state between 1999 and 2012, illustrating how different parts of the country have made progress in curbing the disease. These visualizations are accompanied by contextual observations and reasons behind the positive trends.

“Cancer Will Lose” shines a light on the collaborative efforts between doctors, researchers, and patients on the frontlines of the fight against cancer.

Three smartphones display different types of information: the first shows health data with a line graph and text about cancer mortality. The second shows a colorful stacked bar chart. The third shows a U.S. map with color-coded health statistics. Orange background.
A colorful abstract design featuring undulating horizontal stripes in shades of orange, yellow, purple, blue, green, pink, and red, set against a dark gray background. The stripes vary in width and create a layered, wave-like effect.
An inspirational quote by Dr. Sandra Horning, M.D. reads, "Fighting cancer is a shared responsibility. We're all in this together—each and every person." A note at the bottom invites readers to learn more about Dr. Horning's perspective on the Cancer Moonshot initiative.
A computer monitor displays a webpage featuring an image of several people in lab coats smiling and interacting. The text on the screen says, "Behind The Breakthroughs" and "Fighting cancer is a shared responsibility." There is a button labeled "Explore the Timeline.
A scientist wearing a lab coat stands in a narrow, dimly lit lab filled with large machines and complex equipment, all casting an eerie green light. He interacts with a screen, appearing focused amidst the intricate array of pipes, wires, and control panels.
A tablet screen displaying a U.S. map with various states shaded in shades of purple to blue representing pancreatic cancer rates in 1999. A dropdown menu labeled "pancreas" and a line graph showing timeline from 1999-2012 are also visible.
A tablet screen displays a map of the United States with states color-coded by cancer mortality rates per 100,000 people in 1999. A bar graph on top shows data from 1999 to 2012. Text encouraging social media interaction is below the map.

Project Credits

Project Team
Ready to unlock the potential of your nonprofit's brand?
Reach Out