Work

The Future of Work and Cities

Three existential forces — rapid urbanization, technological upheaval of our labor force, and climate change — are on a collision course. What’s at stake for the future of work and cities?

Background

WeWork and the Aspen Institute’s Future of Work Initiative partnered together to explore the triple challenges of urbanization, technological revolution, and climate change. With the goal of understanding the issues through the lens of people that are experiencing them first-hand, they conducted the largest-ever survey of 30,000 workers and business decision makers in 50 cities around the world (30 cities in the U.S., 20 globally). The subsequent findings offer unprecedented insight into how city officials, business decision-makers, and thought leaders can shape the economy, their communities, and their policy proposals to positively influence the well-being of citizens across the world.

Uncovering a story from the numbers

The original report was presented to Hyperakt in a raw format — a spreadsheet teeming with thousands upon thousands of data points. We got to work unearthing a storyline and establishing a set of 10 key findings that served as entry points for the entire digital experience. The 10 key findings were represented by iconography that helped codify and anchor the user as they scrolled. Bold, monochromatic design anchored the visuals in the WeWork brand language.

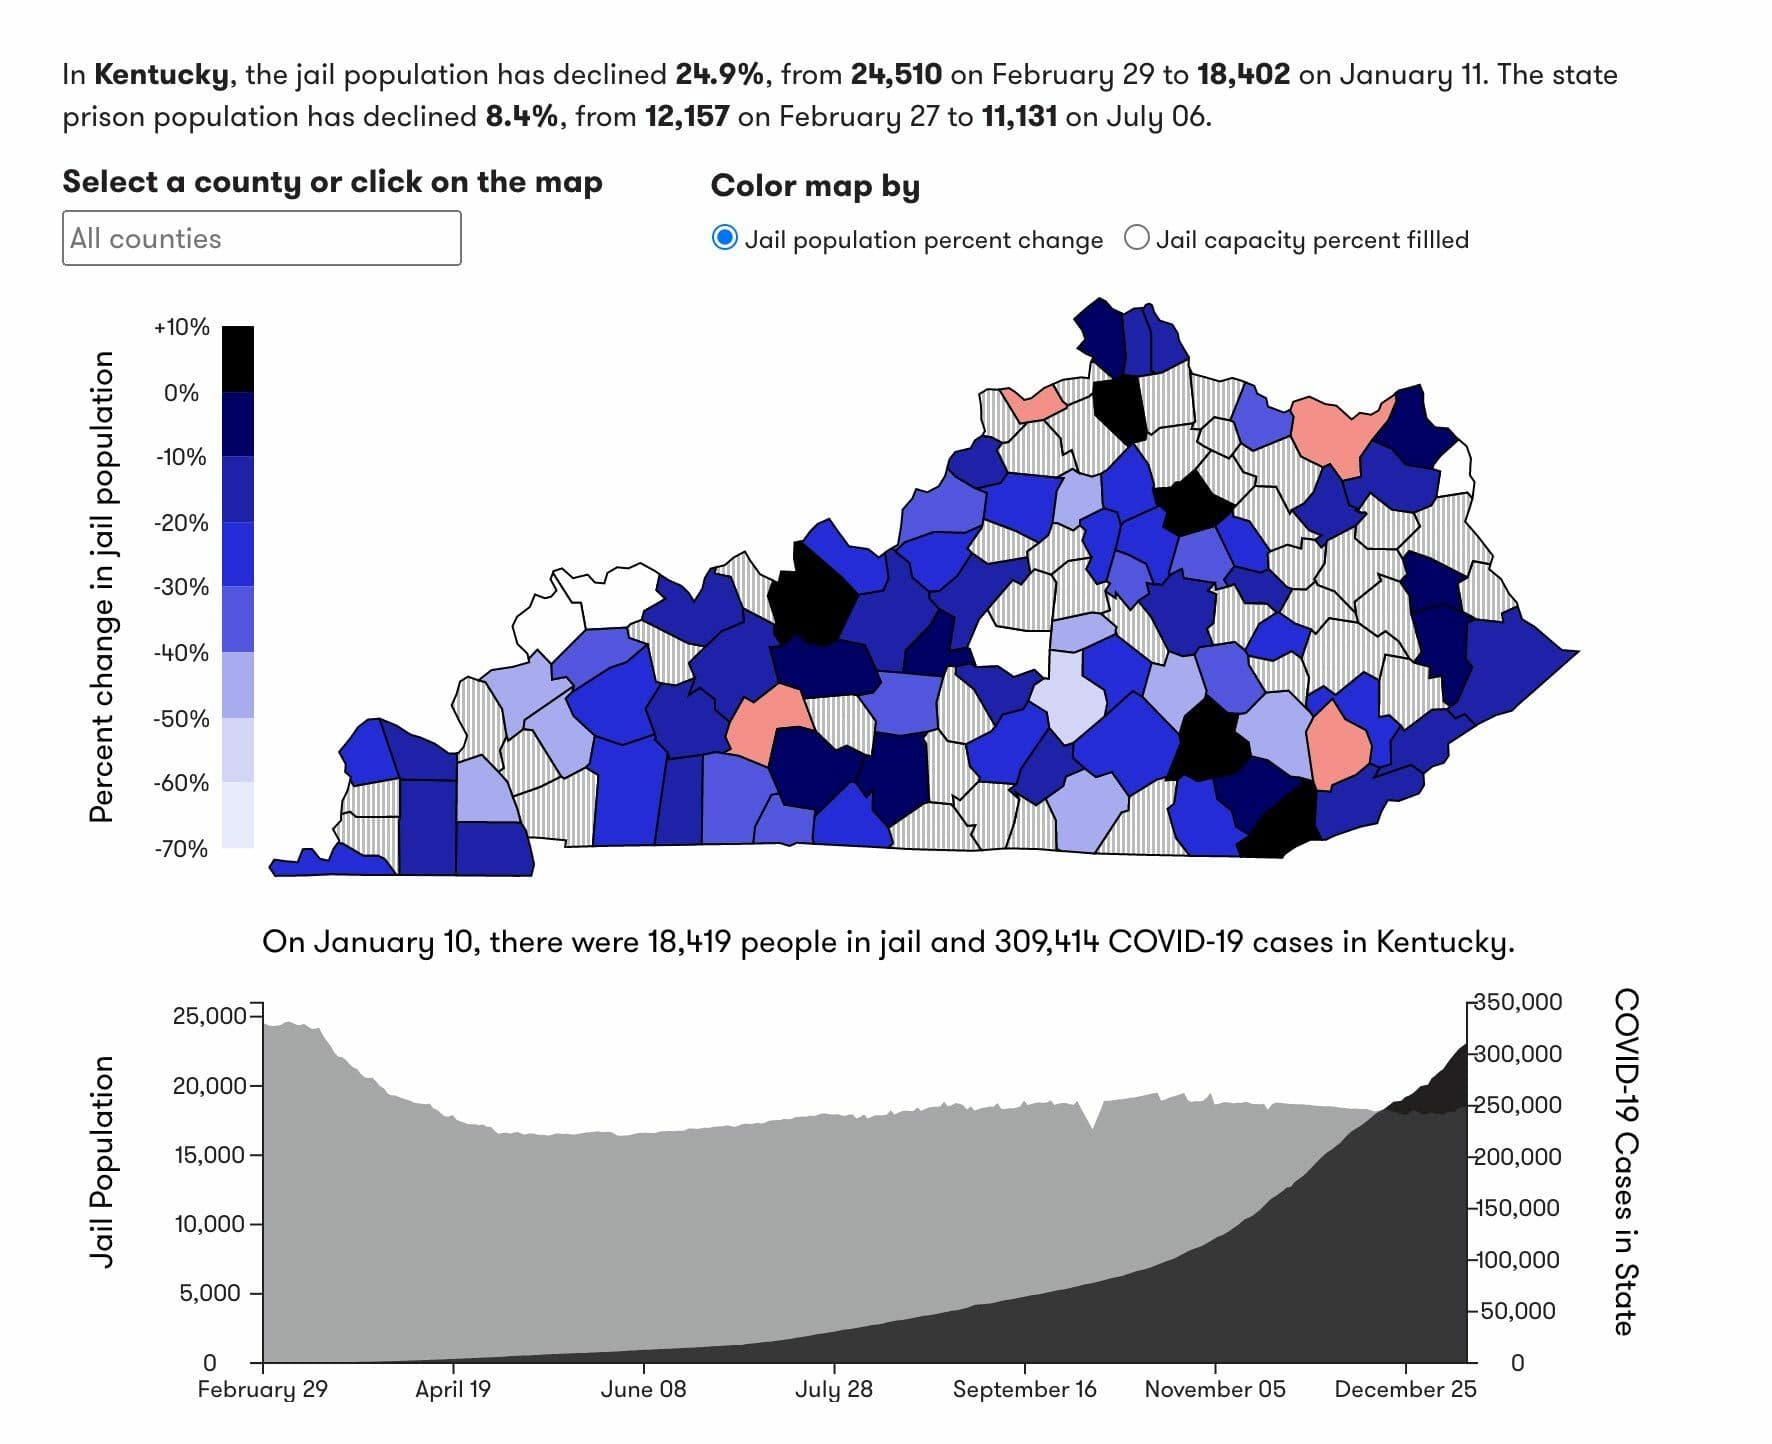
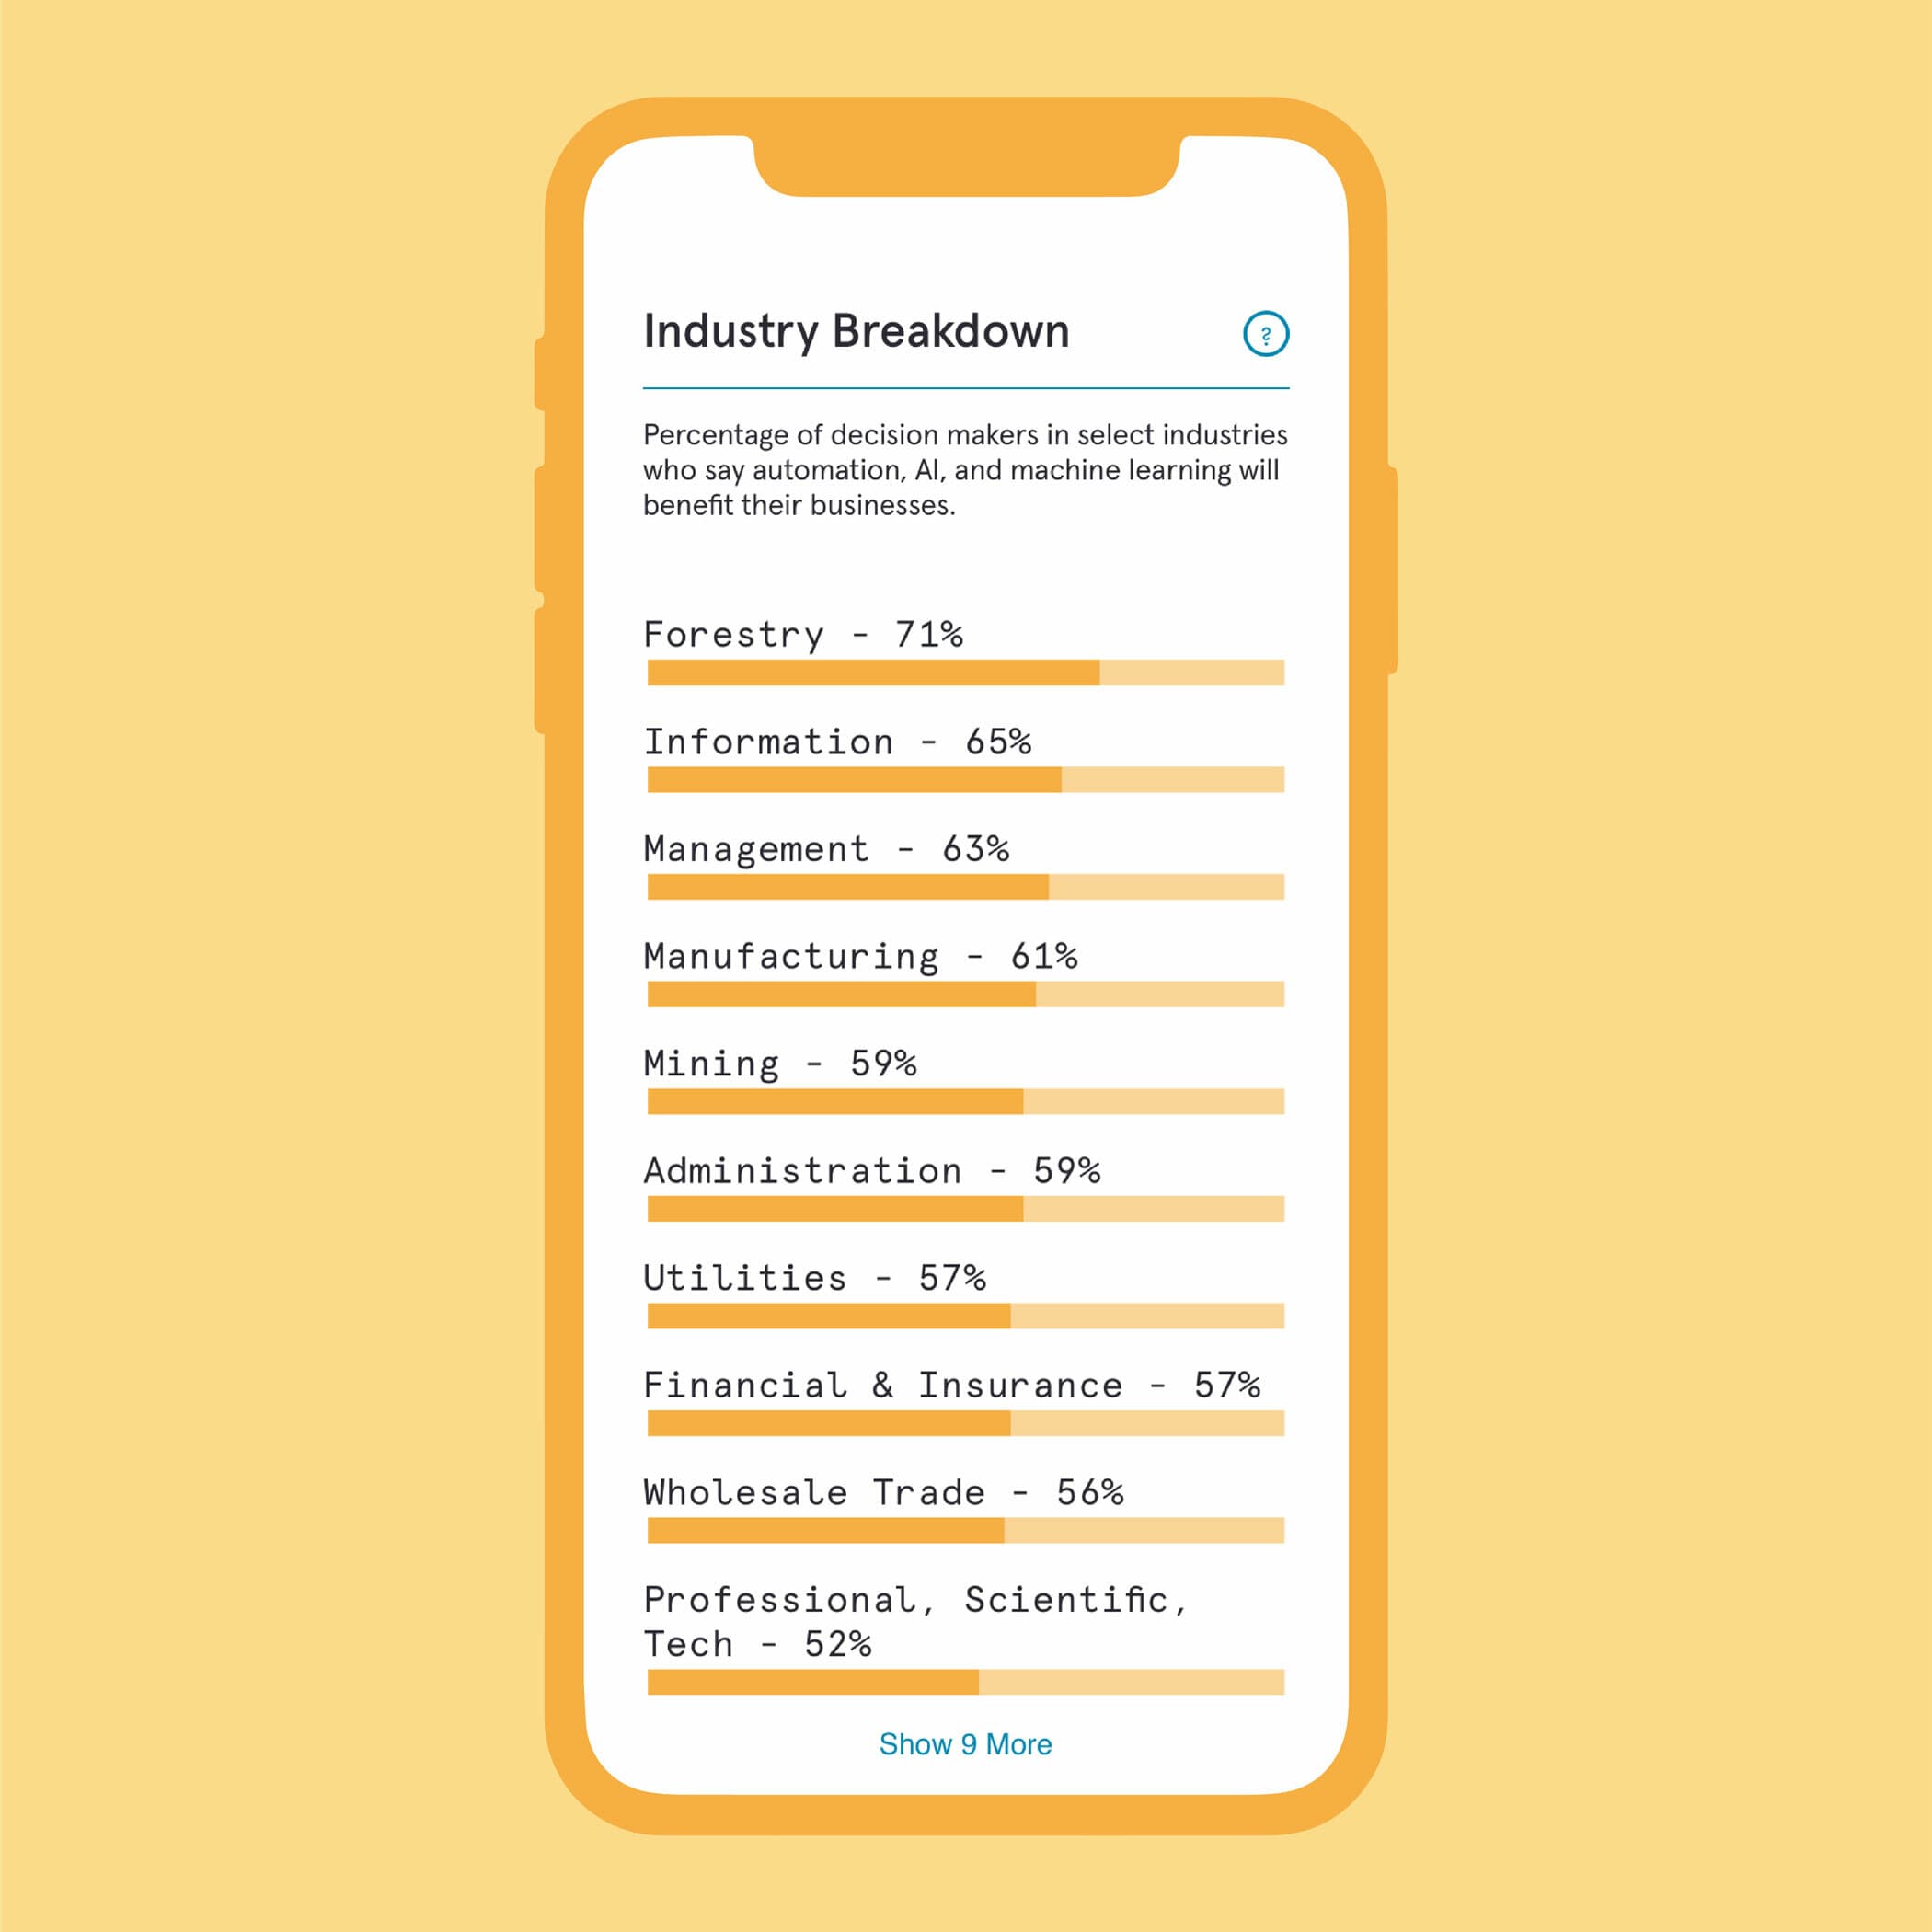
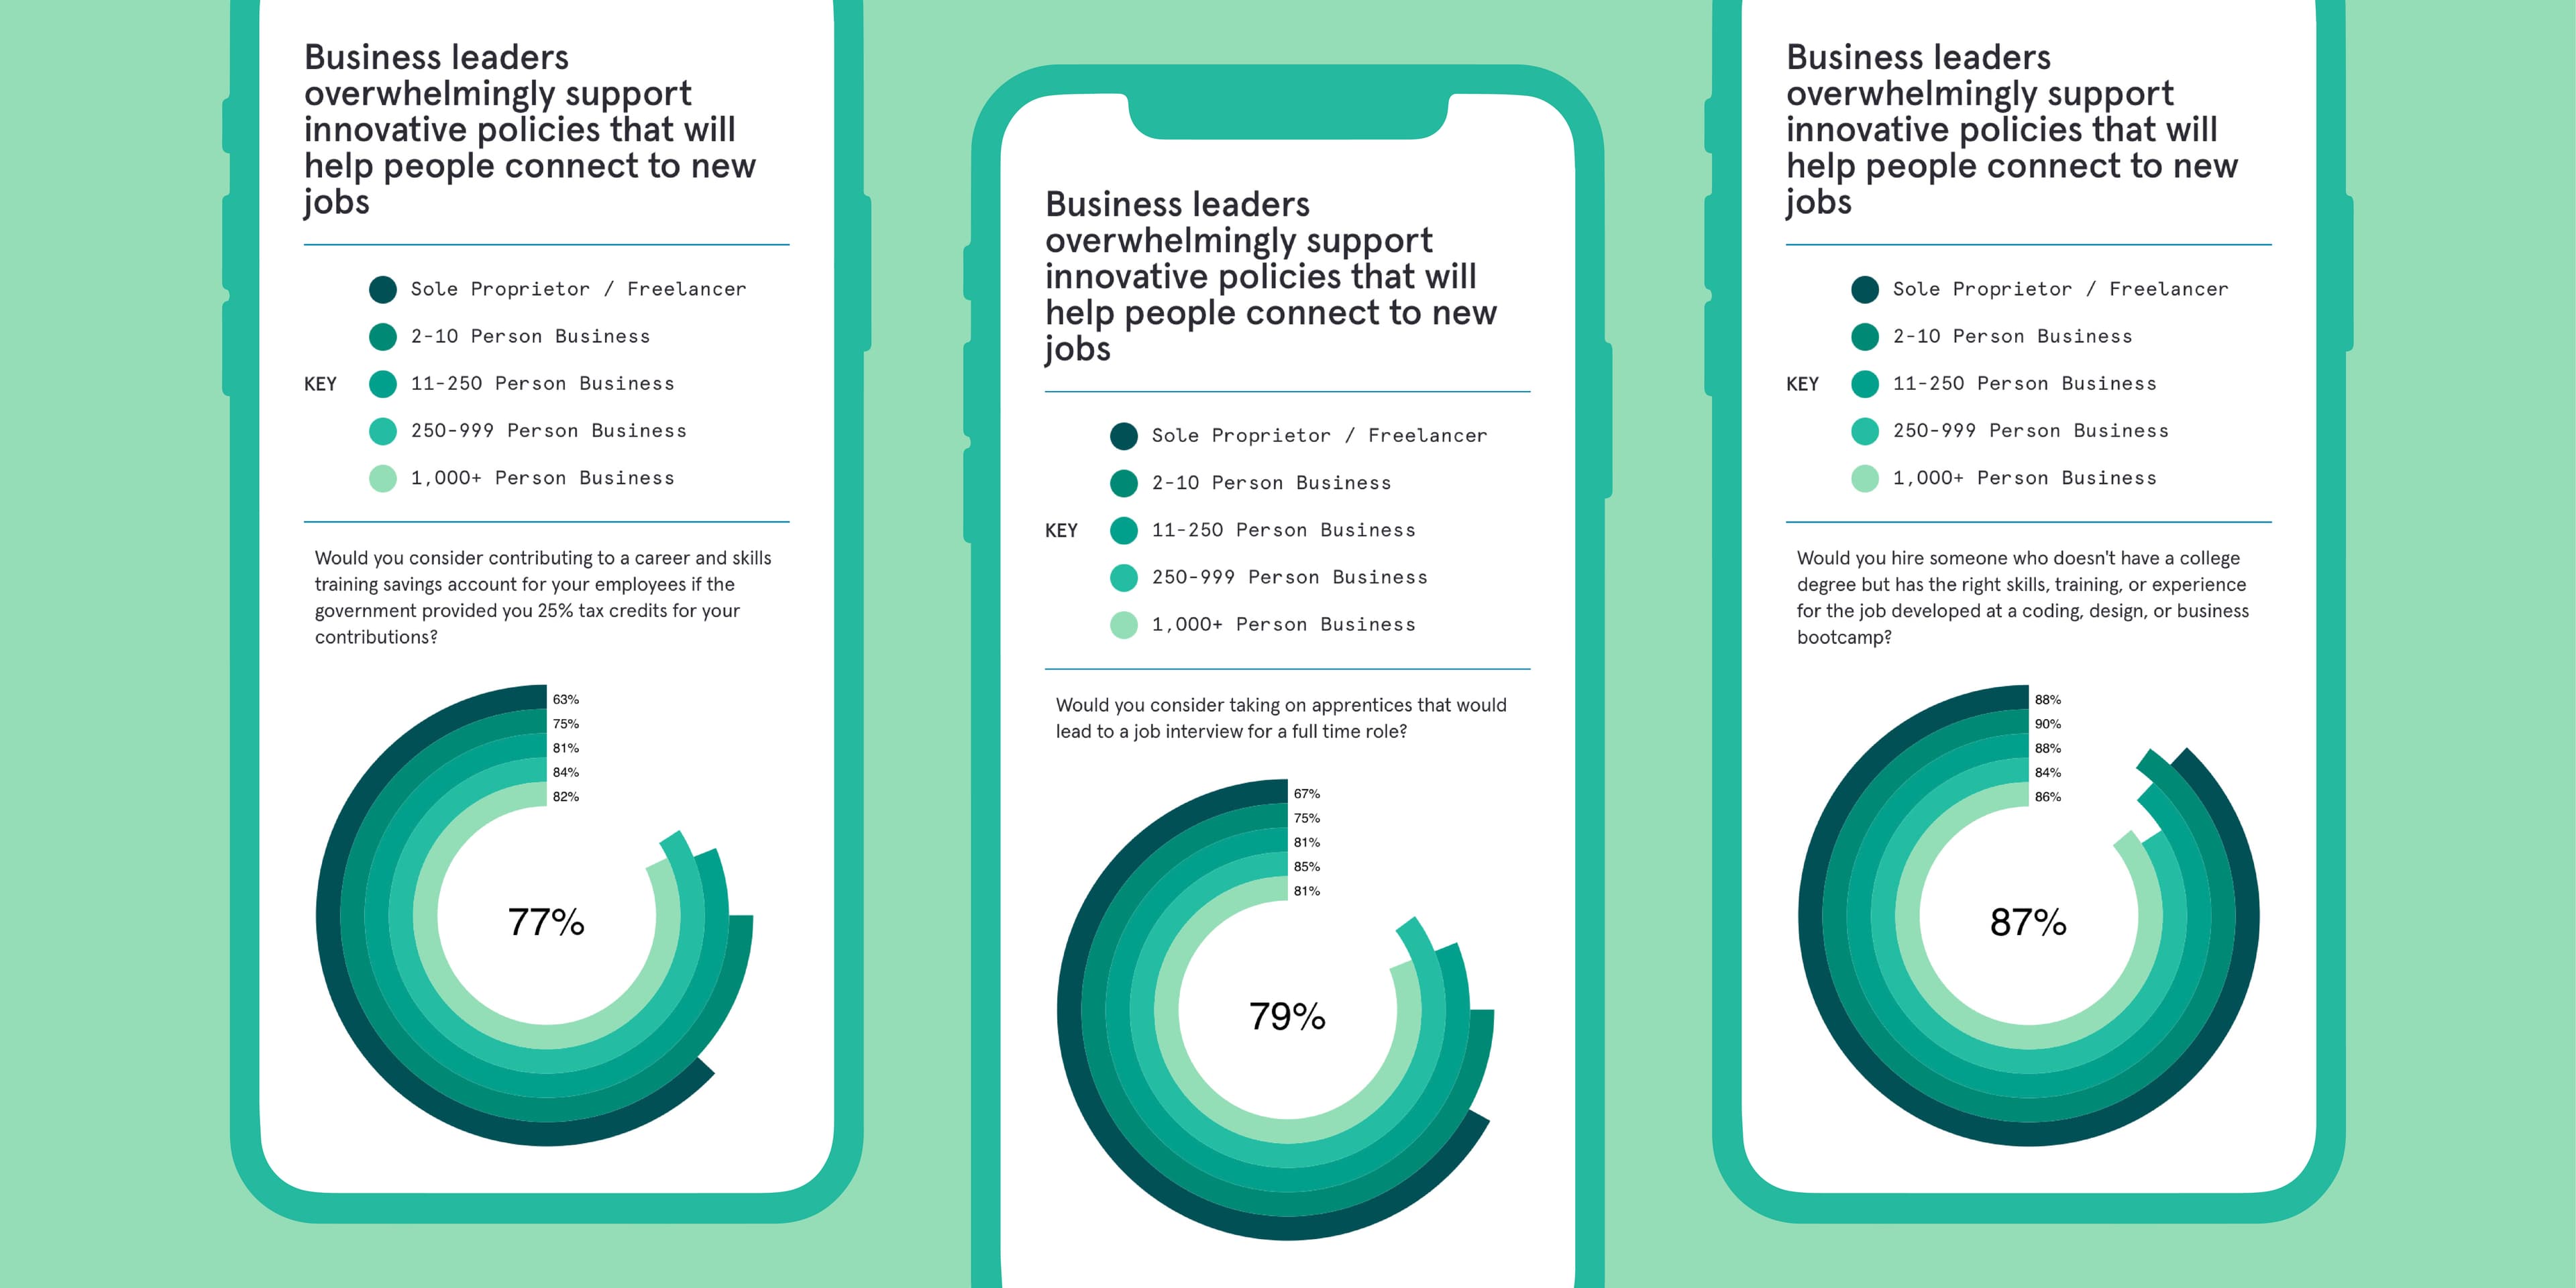
Each of the findings was supported by an interactive data visualization that allowed the user to dive deeper into the finding through the lens of the cities that mattered to them.

An infographic on a smartphone screen lists reasons people want besides pay and benefits from companies they work for: work-life balance 40%, sense of community 28%, way they feel at work 21%, company mission 18%, pay 33%, benefits 28%, career advancement 19%.
An infographic on a smartphone screen shows percentages of decision-makers in various industries who believe automation and machine learning will benefit their businesses. The top five percentages are Forestry (71%), Information (65%), and Management (63%).
Three smartphone screens display a survey about business leaders supporting policies for job connections. Each screen shows a different data set with concentric circle charts. Percentages shown are 77%, 79%, and 87%. The background is teal.

Robust data visualization

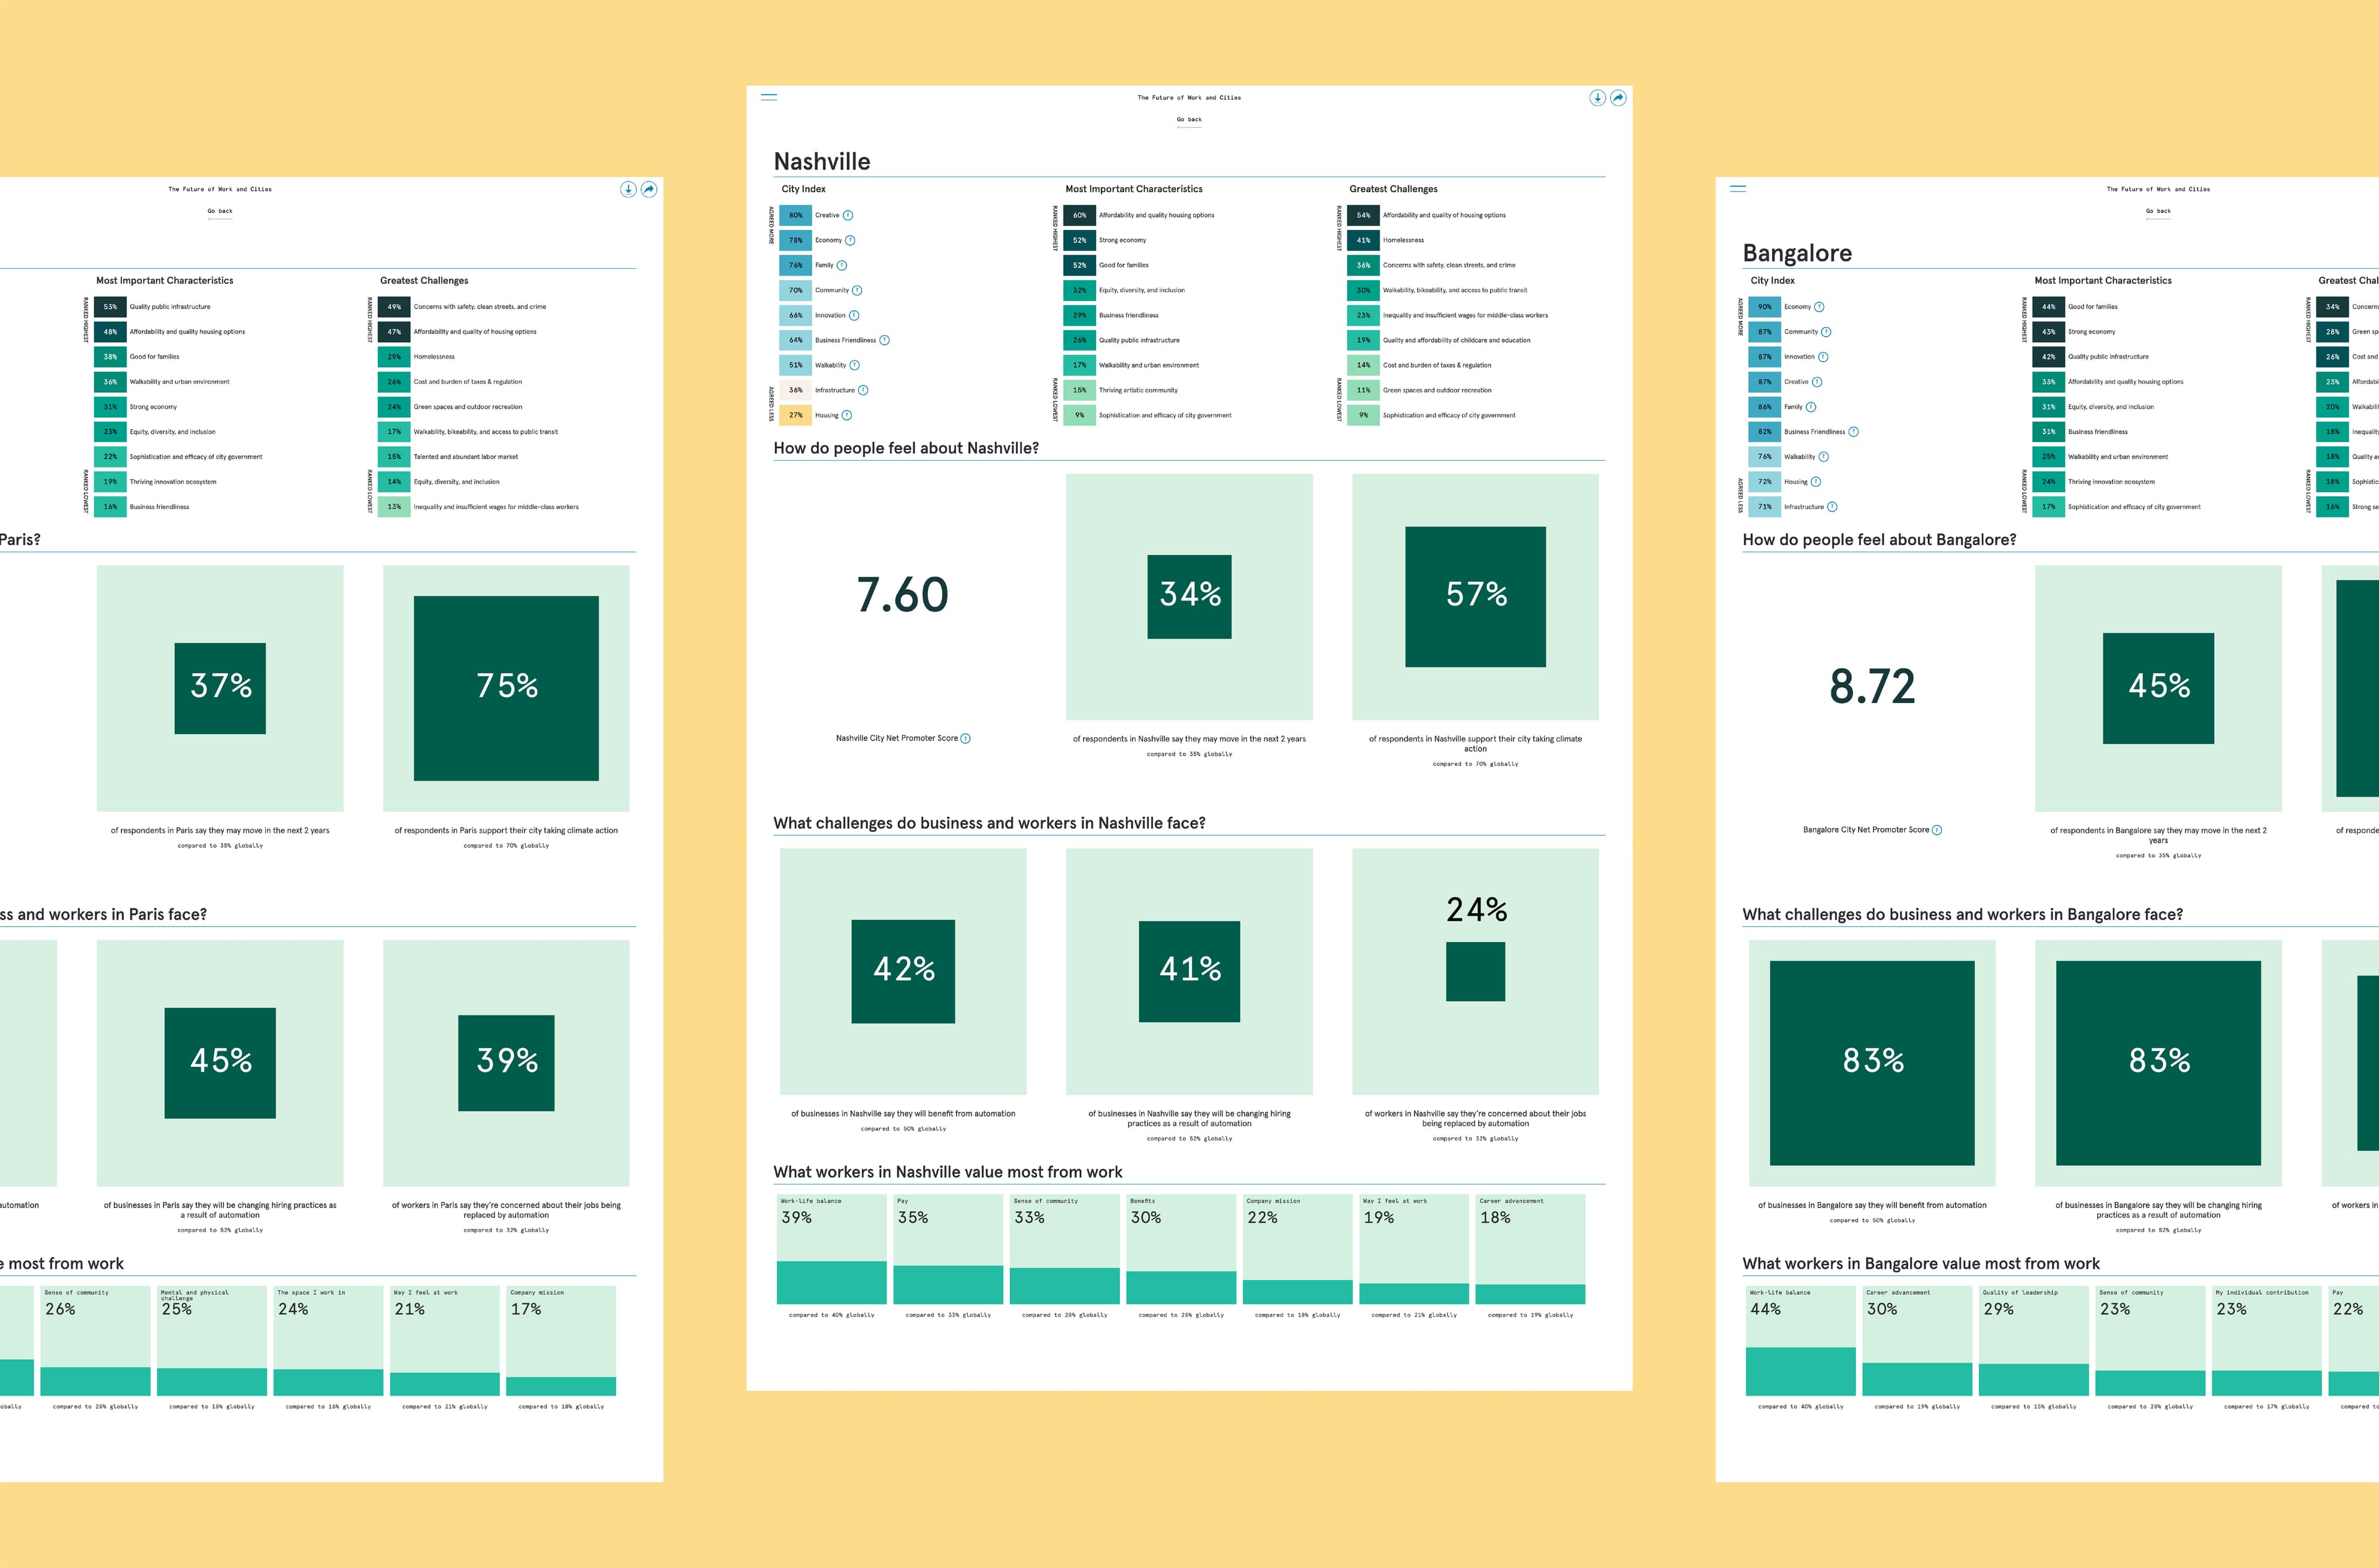
The central data visualization of the entire experience was the city index. This interactive matrix allowed users to browse how each of the 50 cities ranked nine dimensions of living and work.

Three side-by-side infographics compare data for Nashville and Bangalore. Each infographic features bar graphs, percentages, and numerical scores. Topics covered include local challenges, business concerns, worker satisfaction, and other related metrics.

Project Credits

Ready to unlock the potential of your nonprofit's brand?
Reach Out