Work

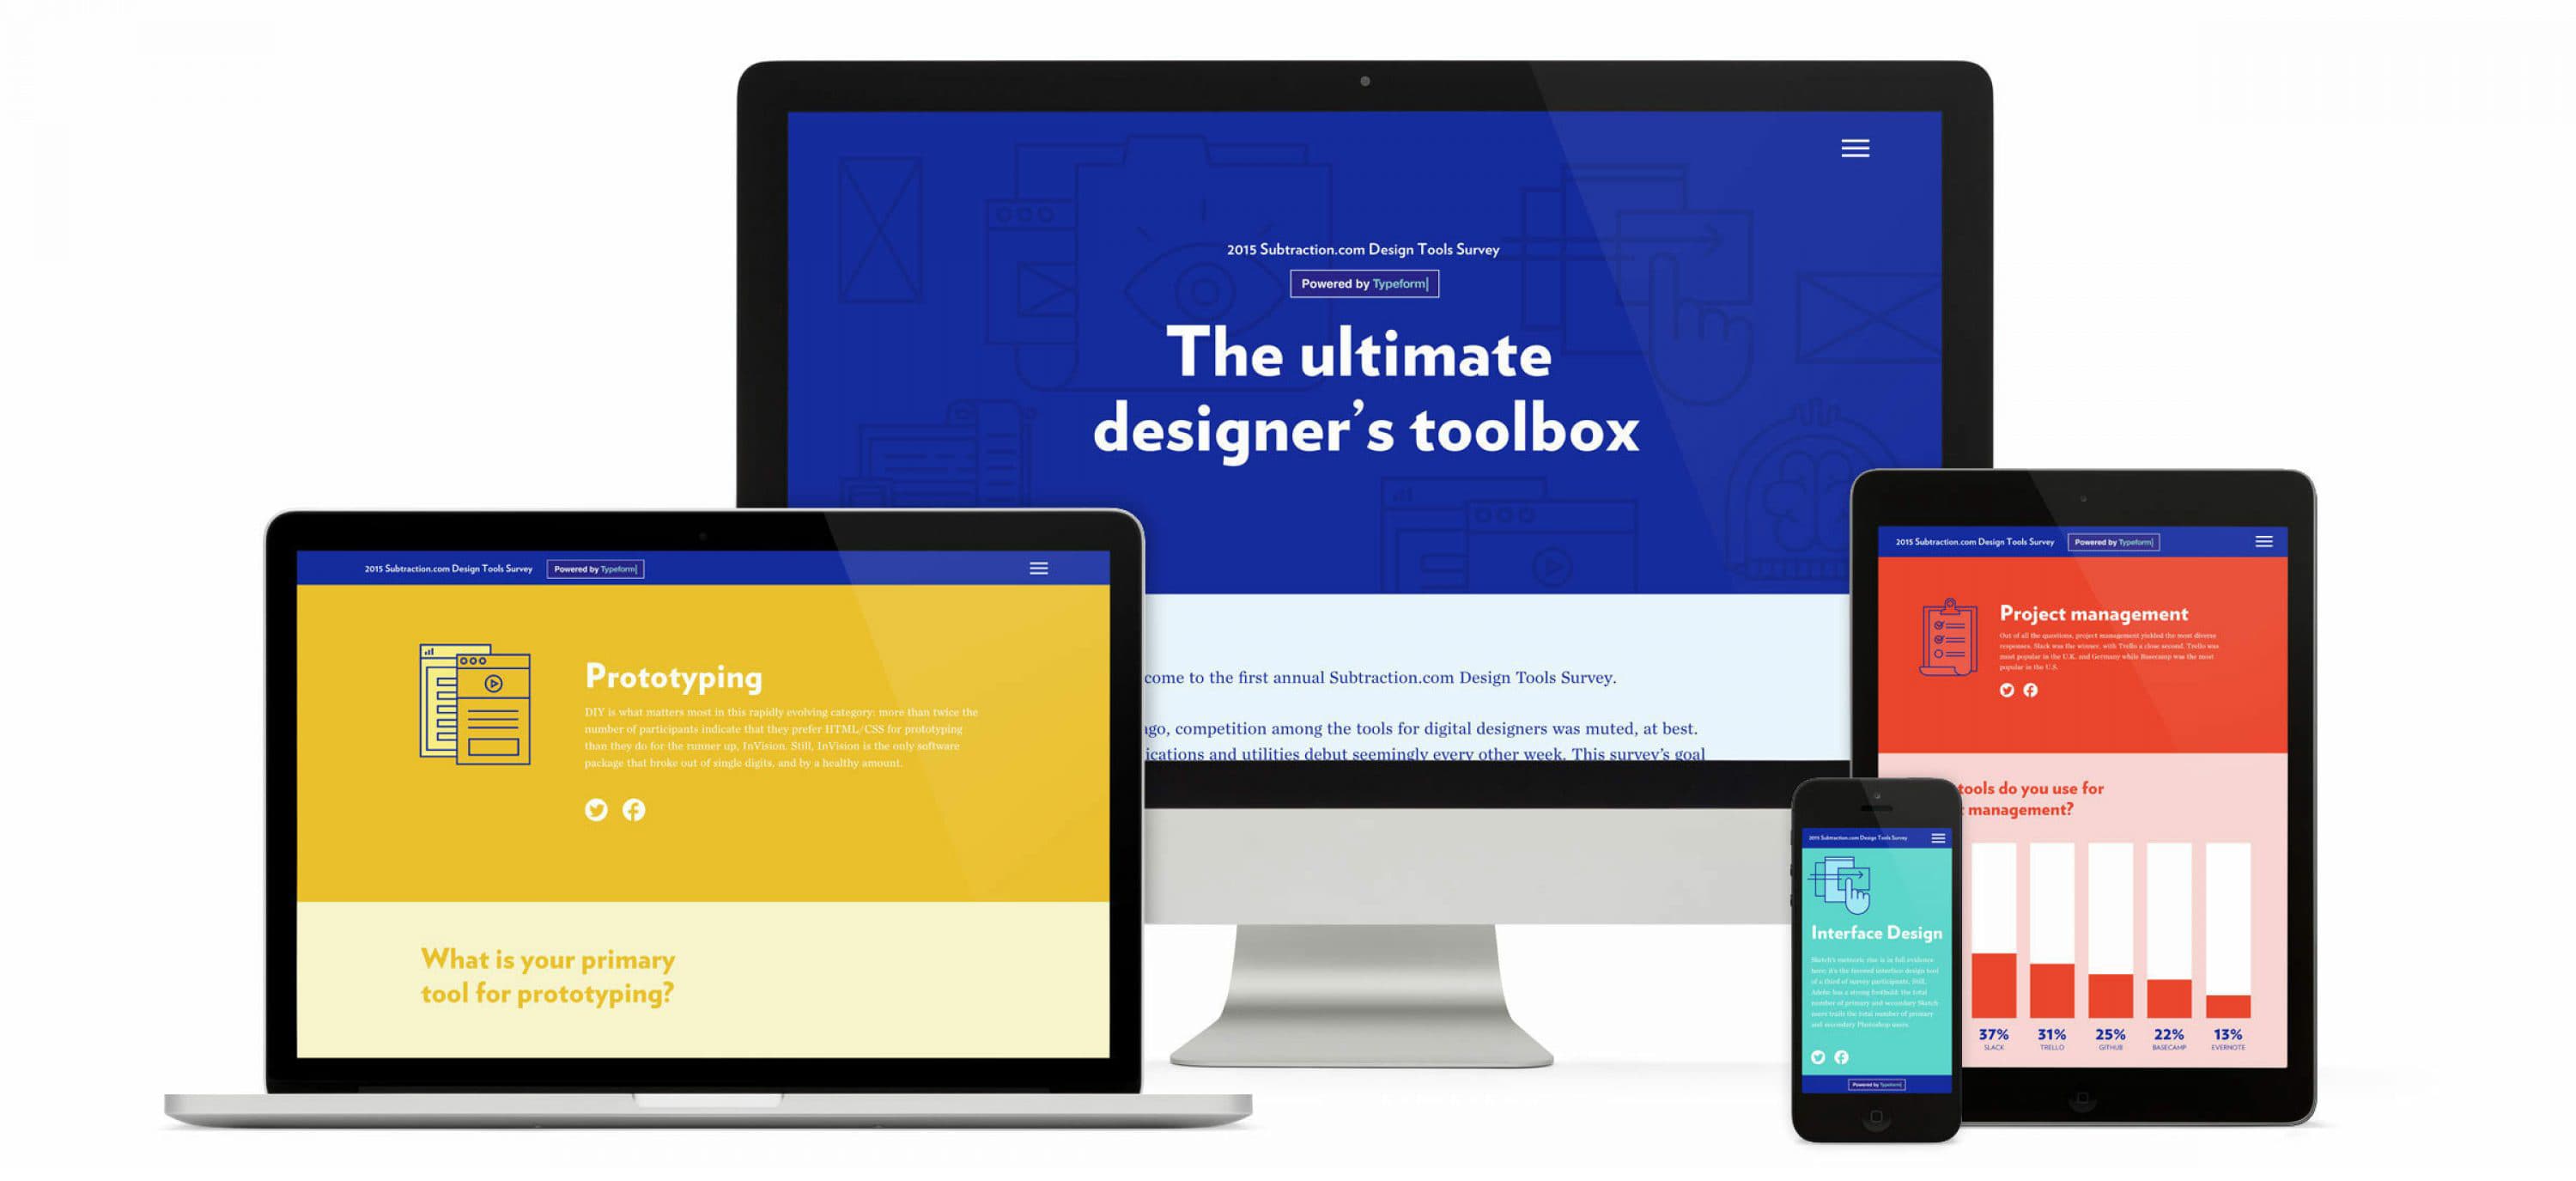
The Ultimate Designer's Toolbox

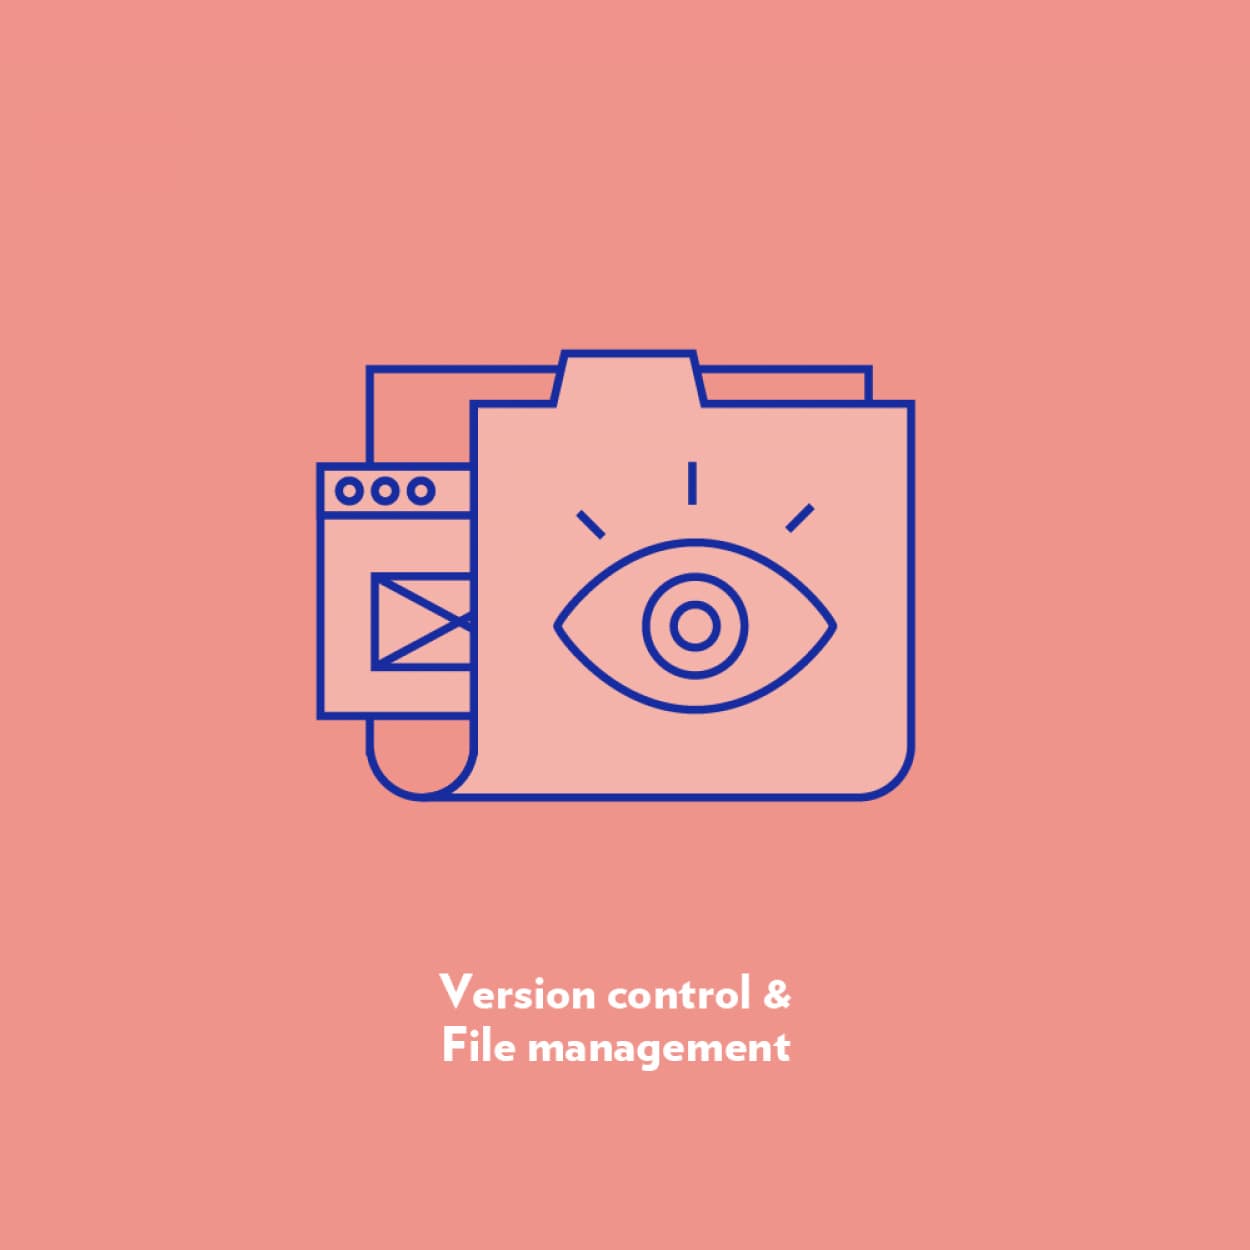
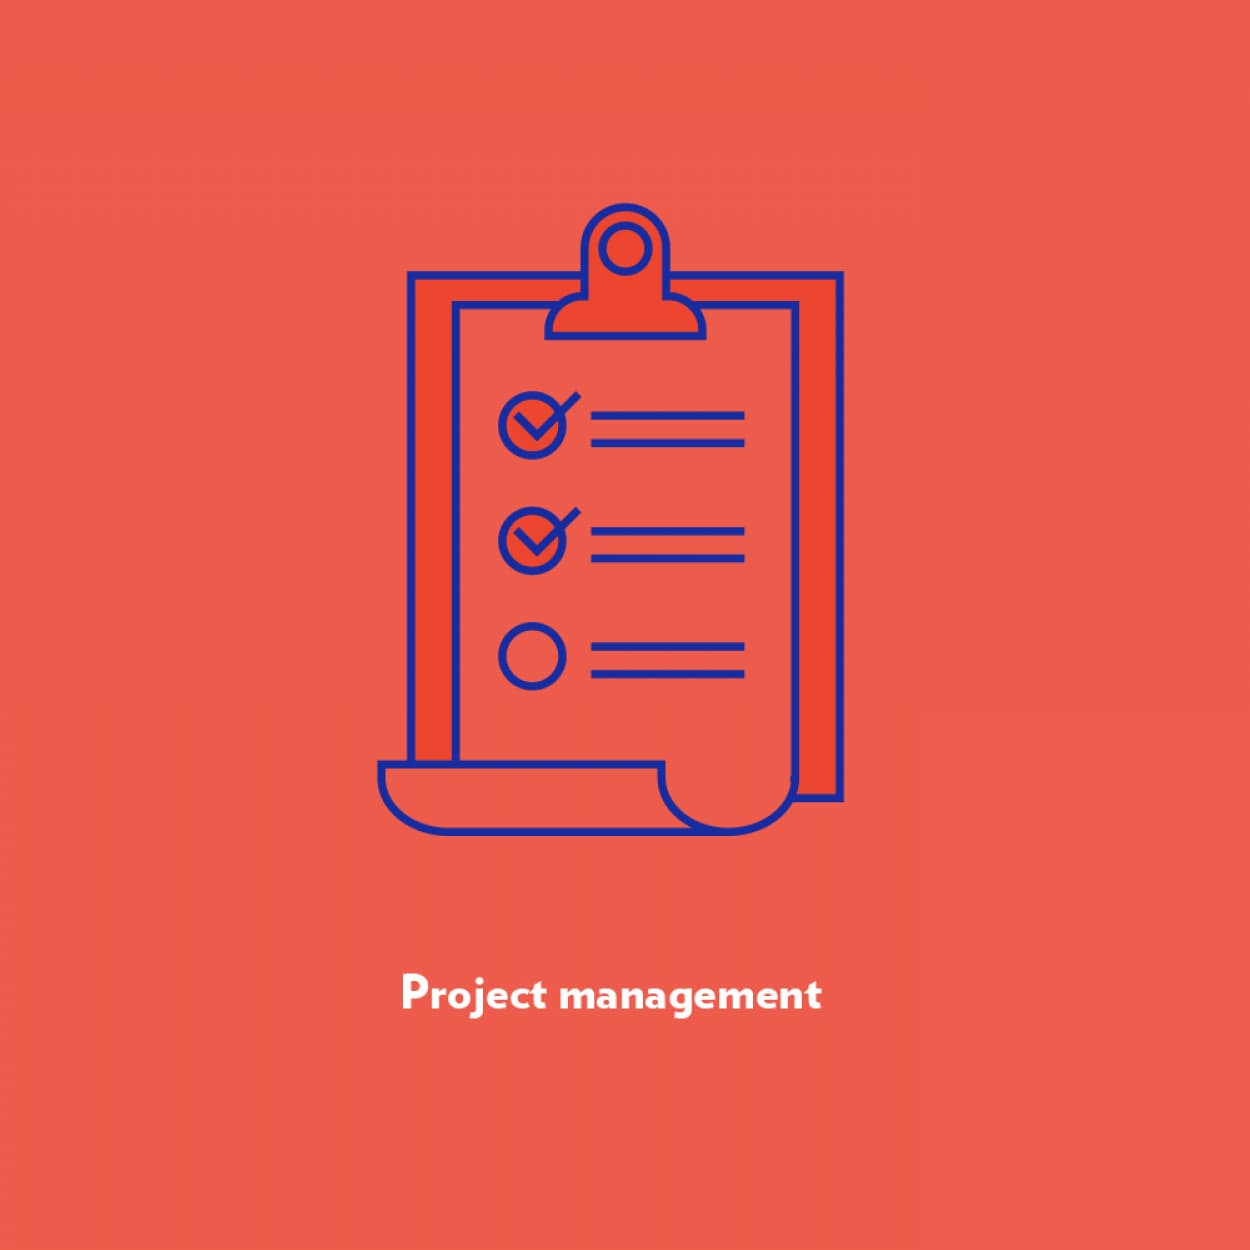
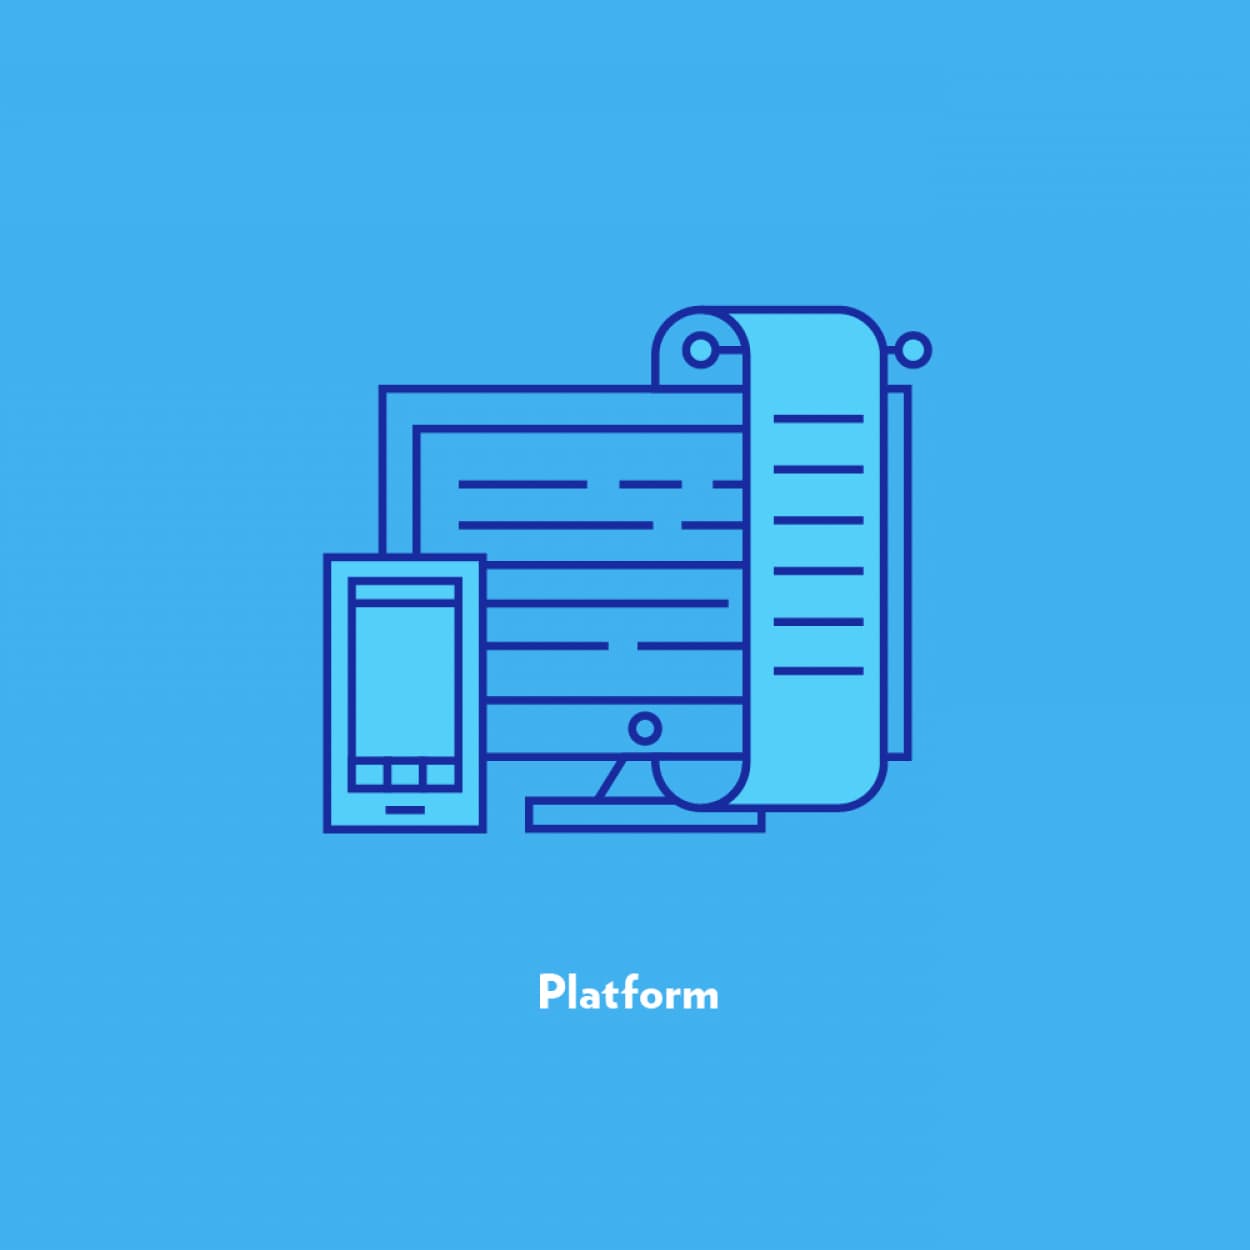
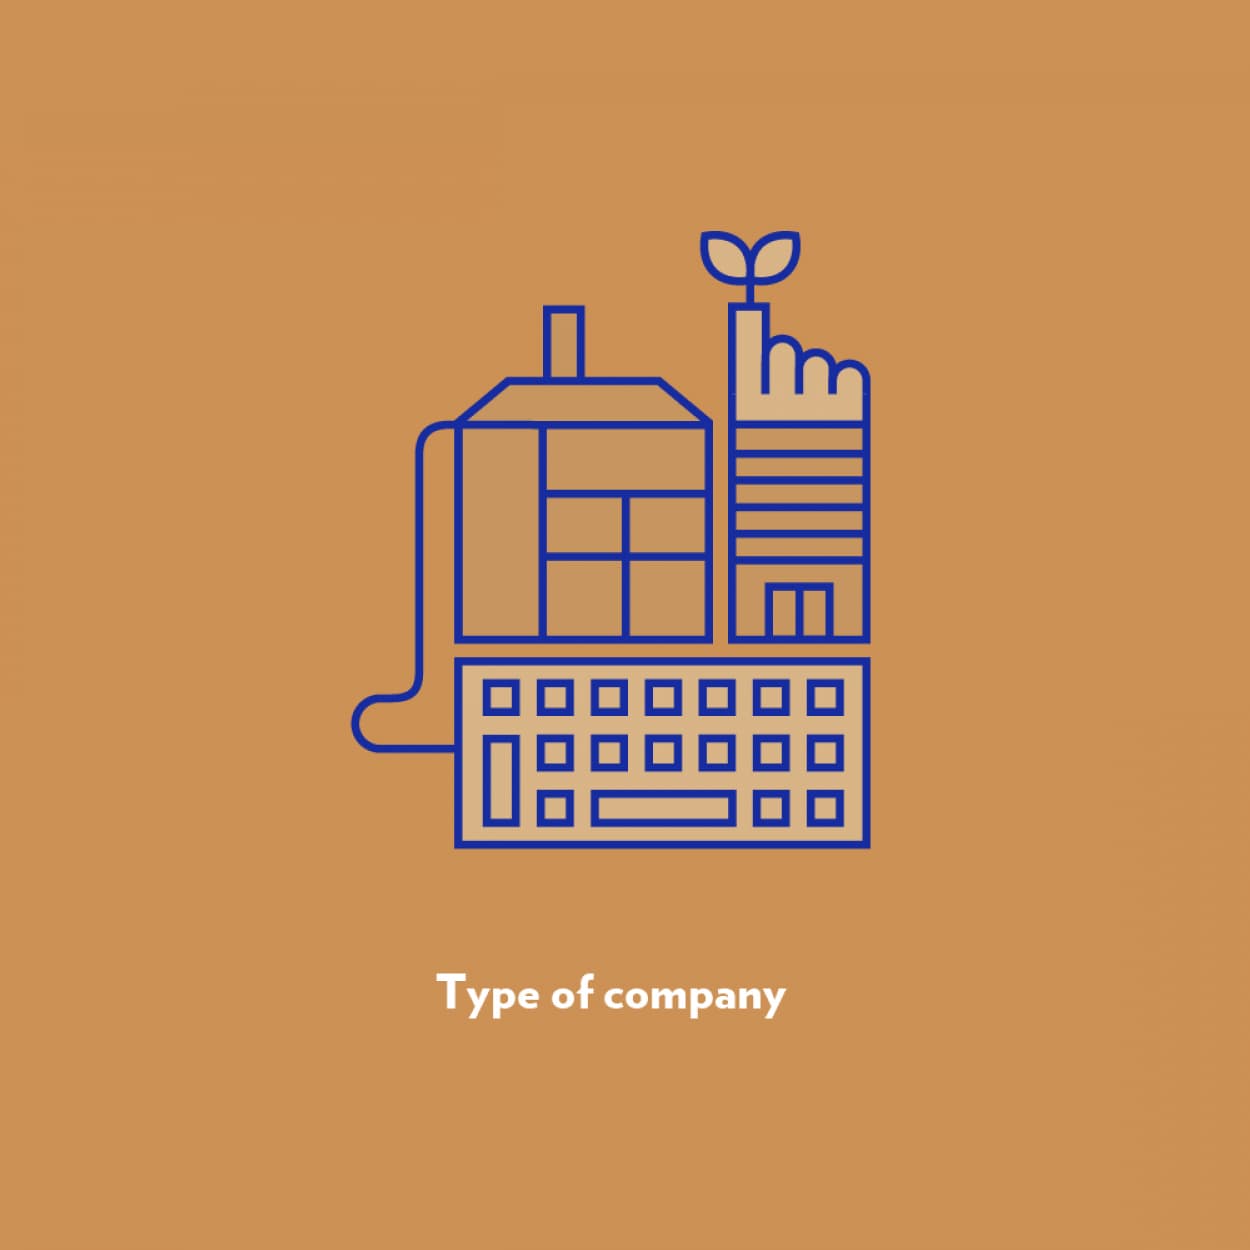
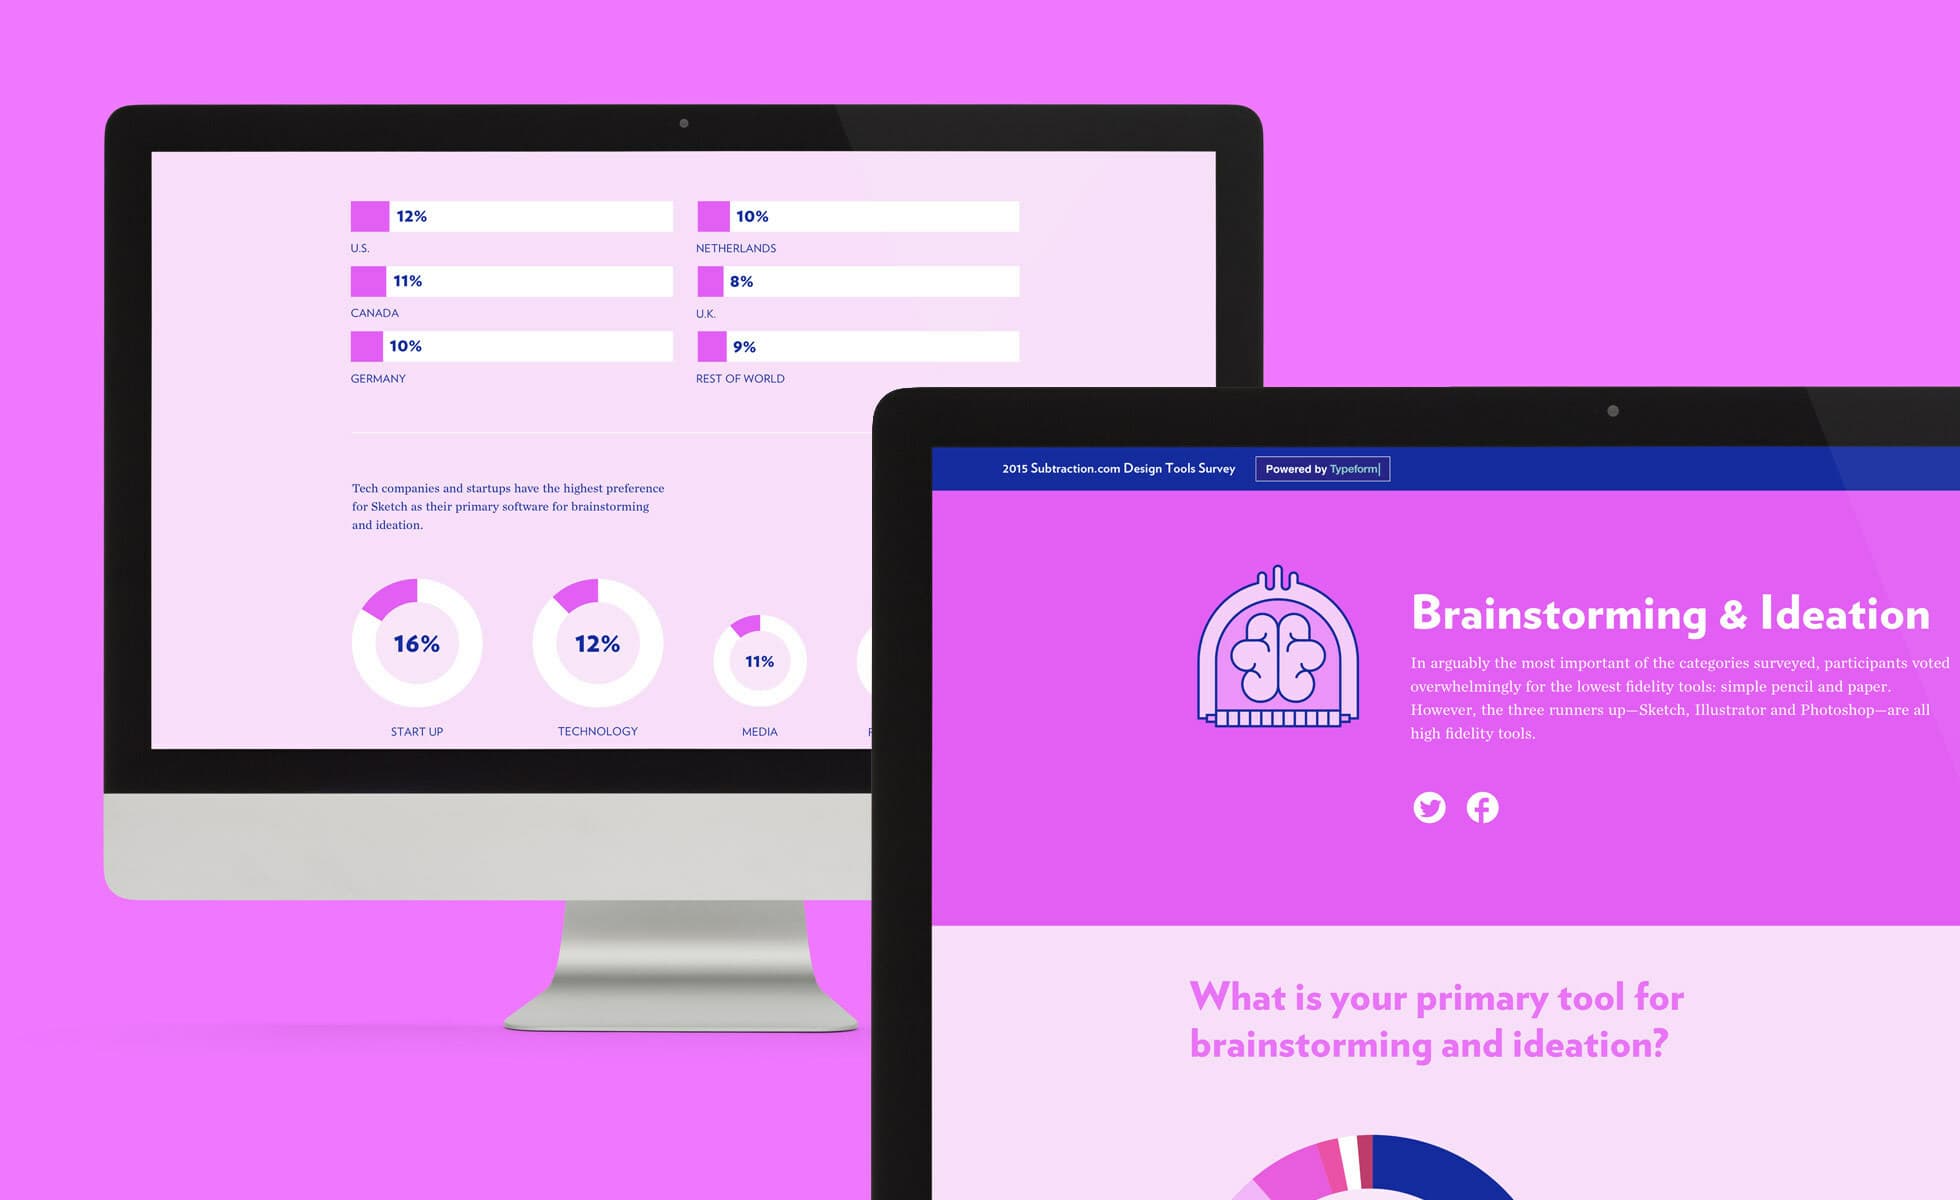
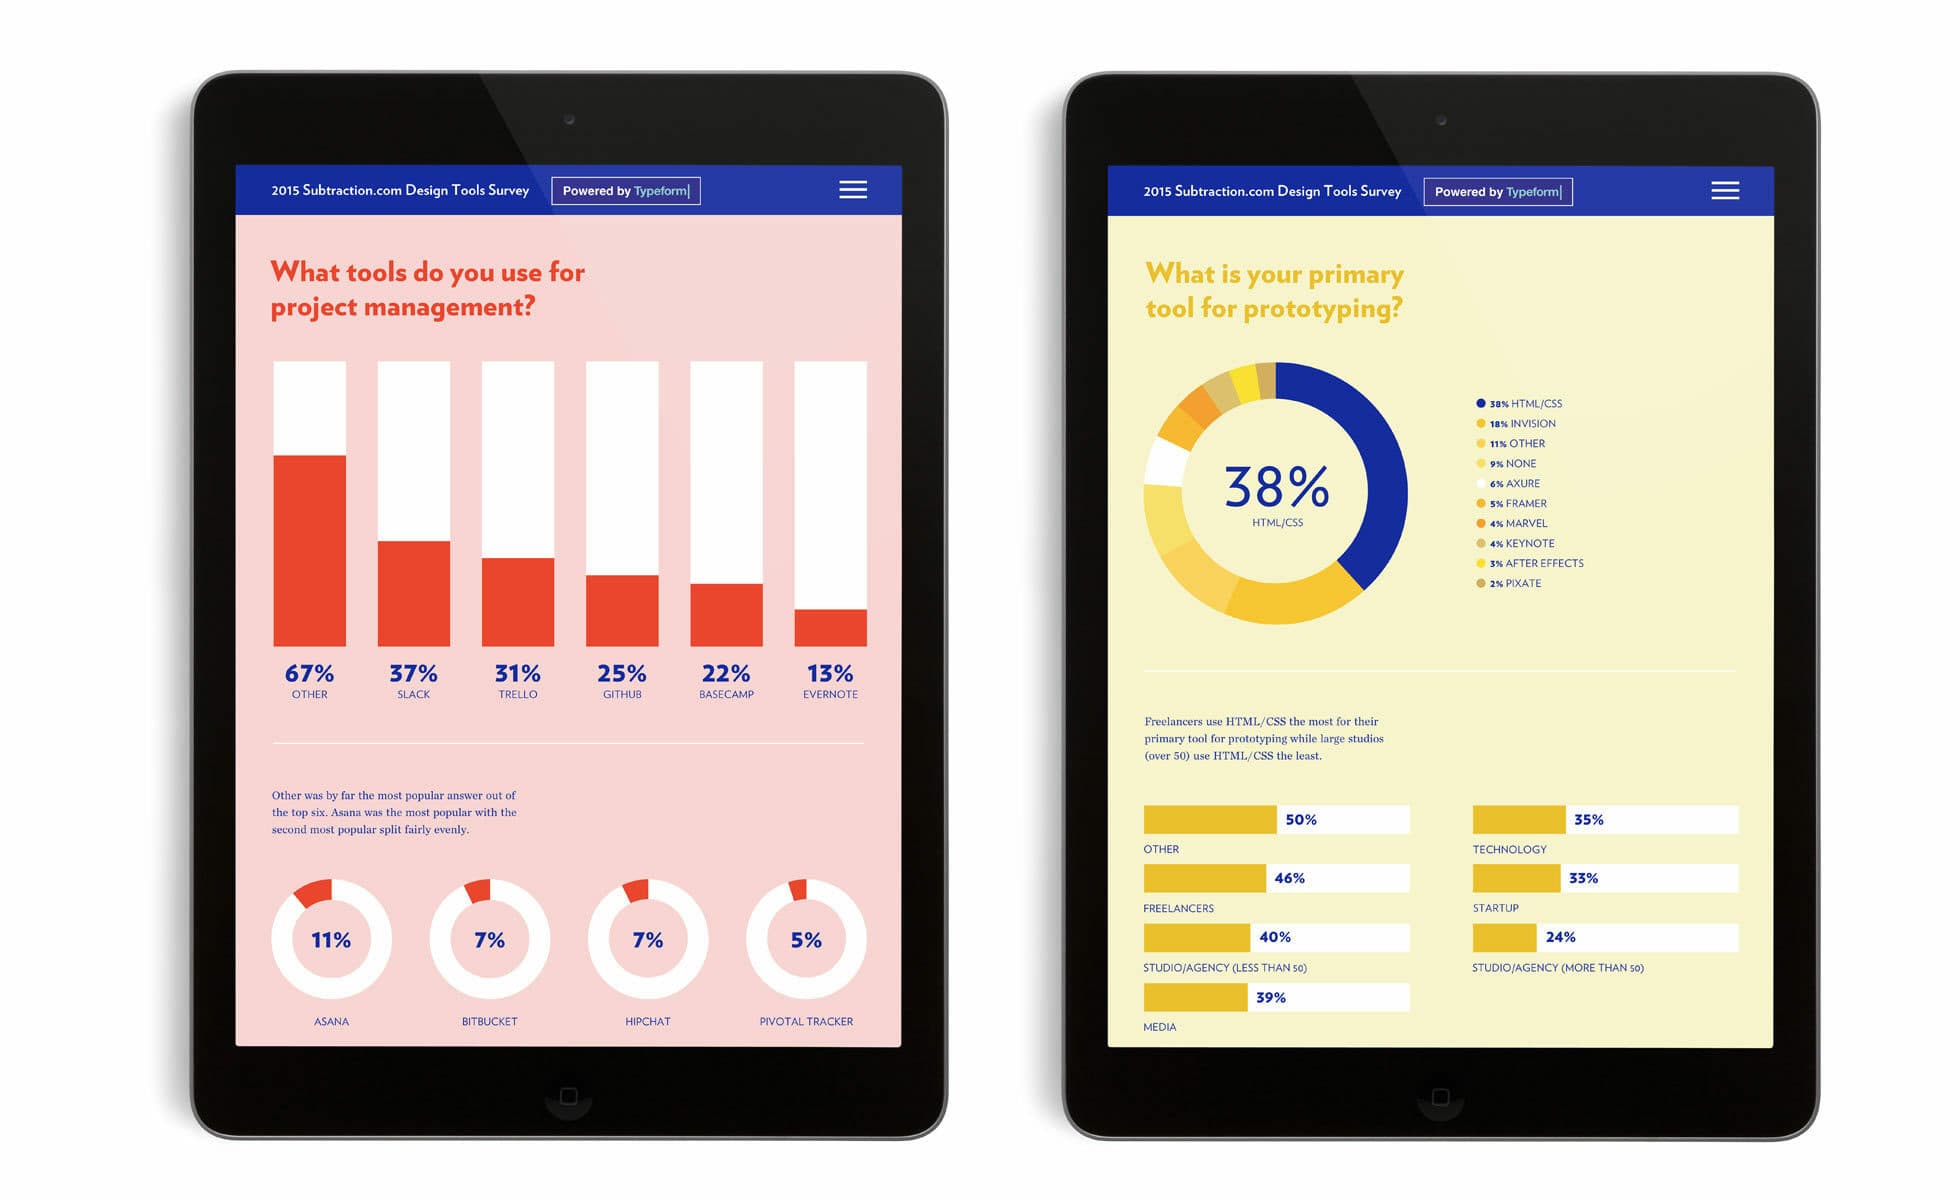
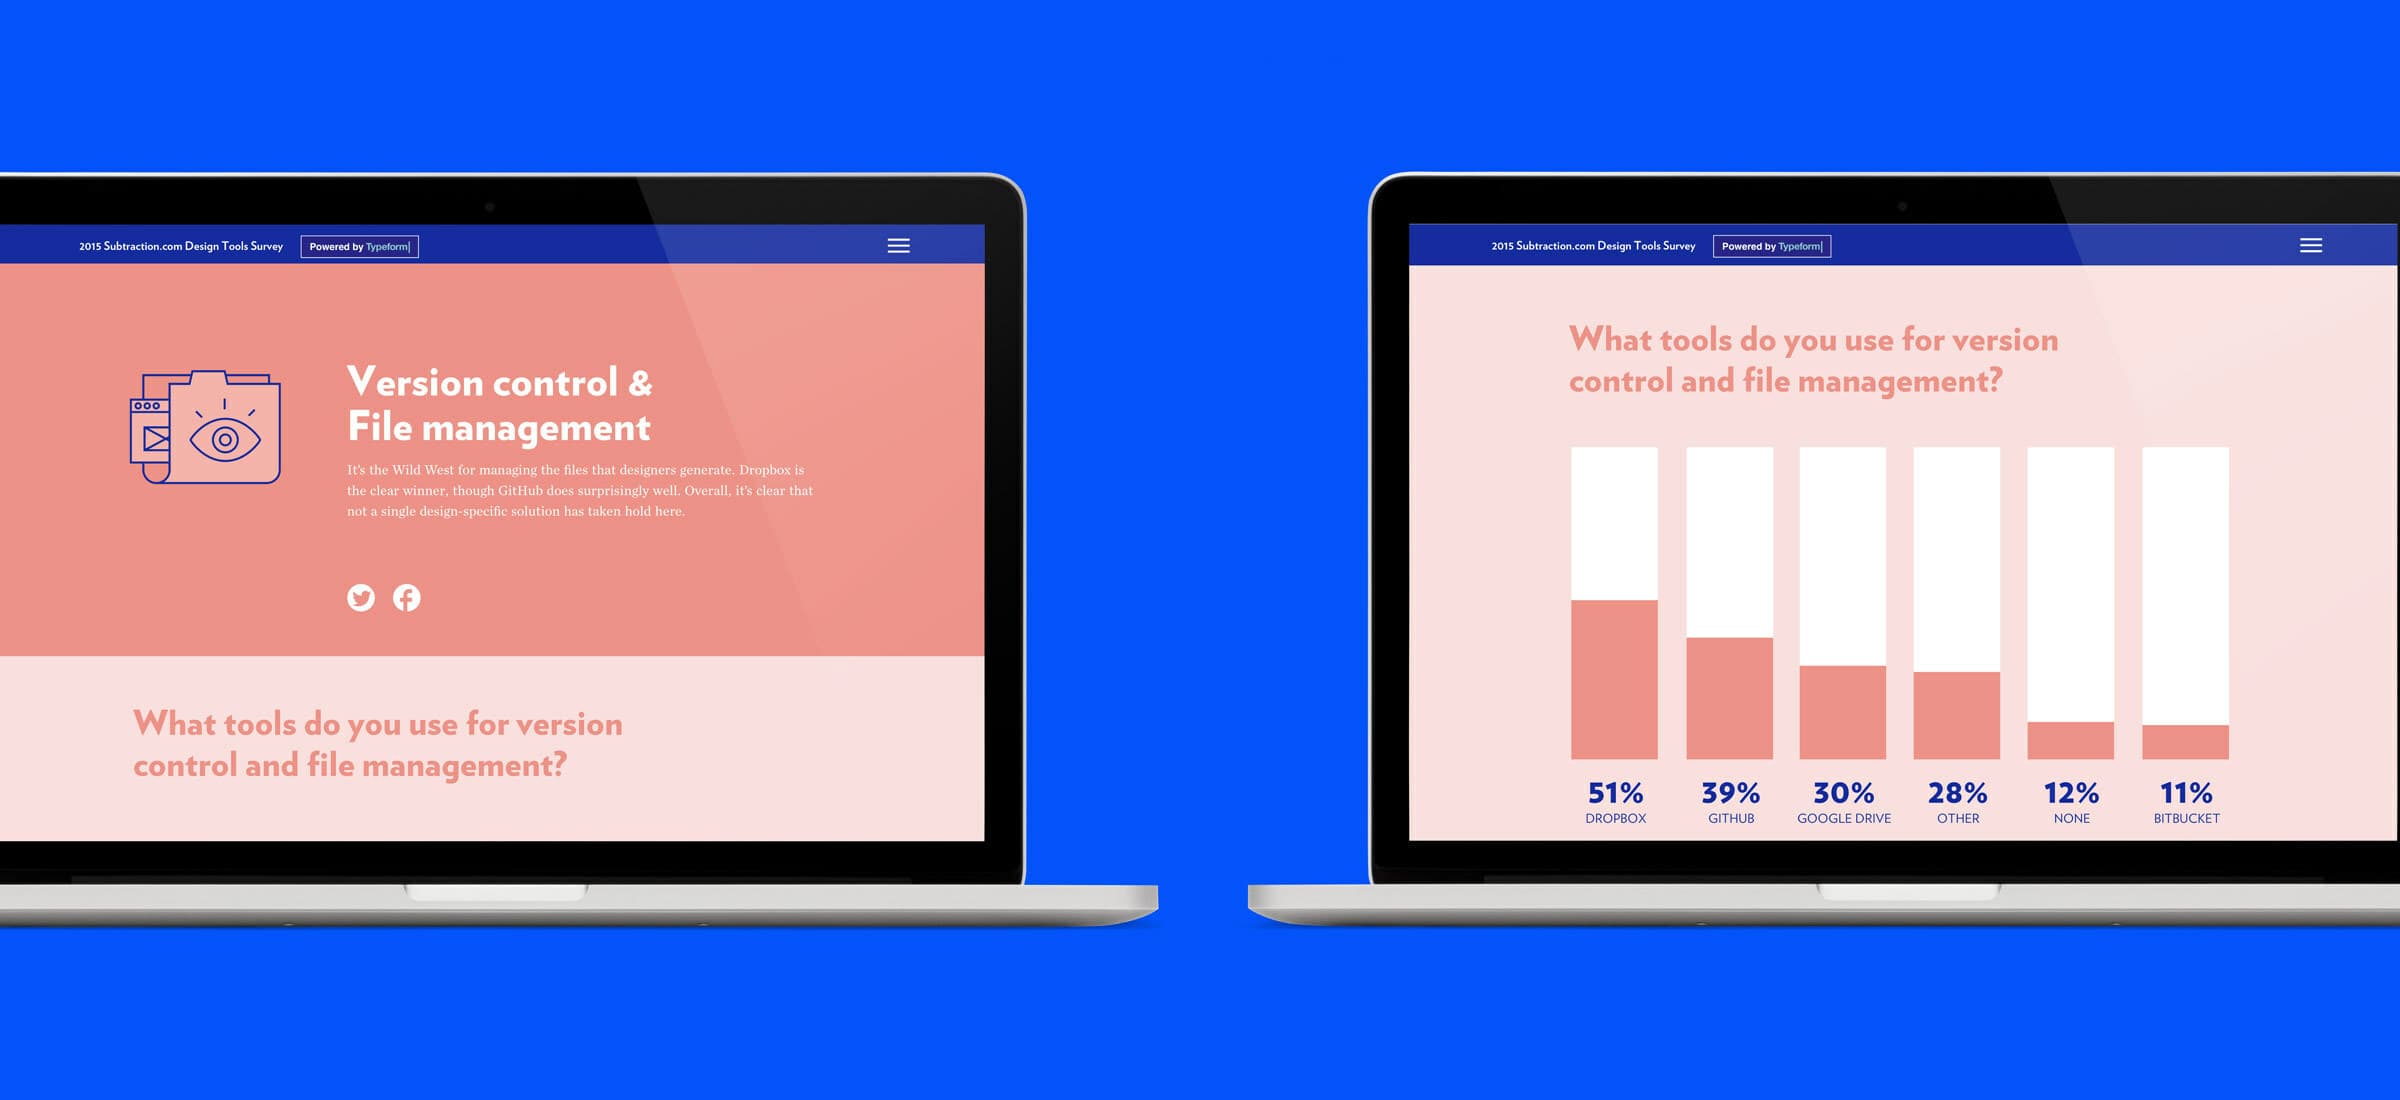
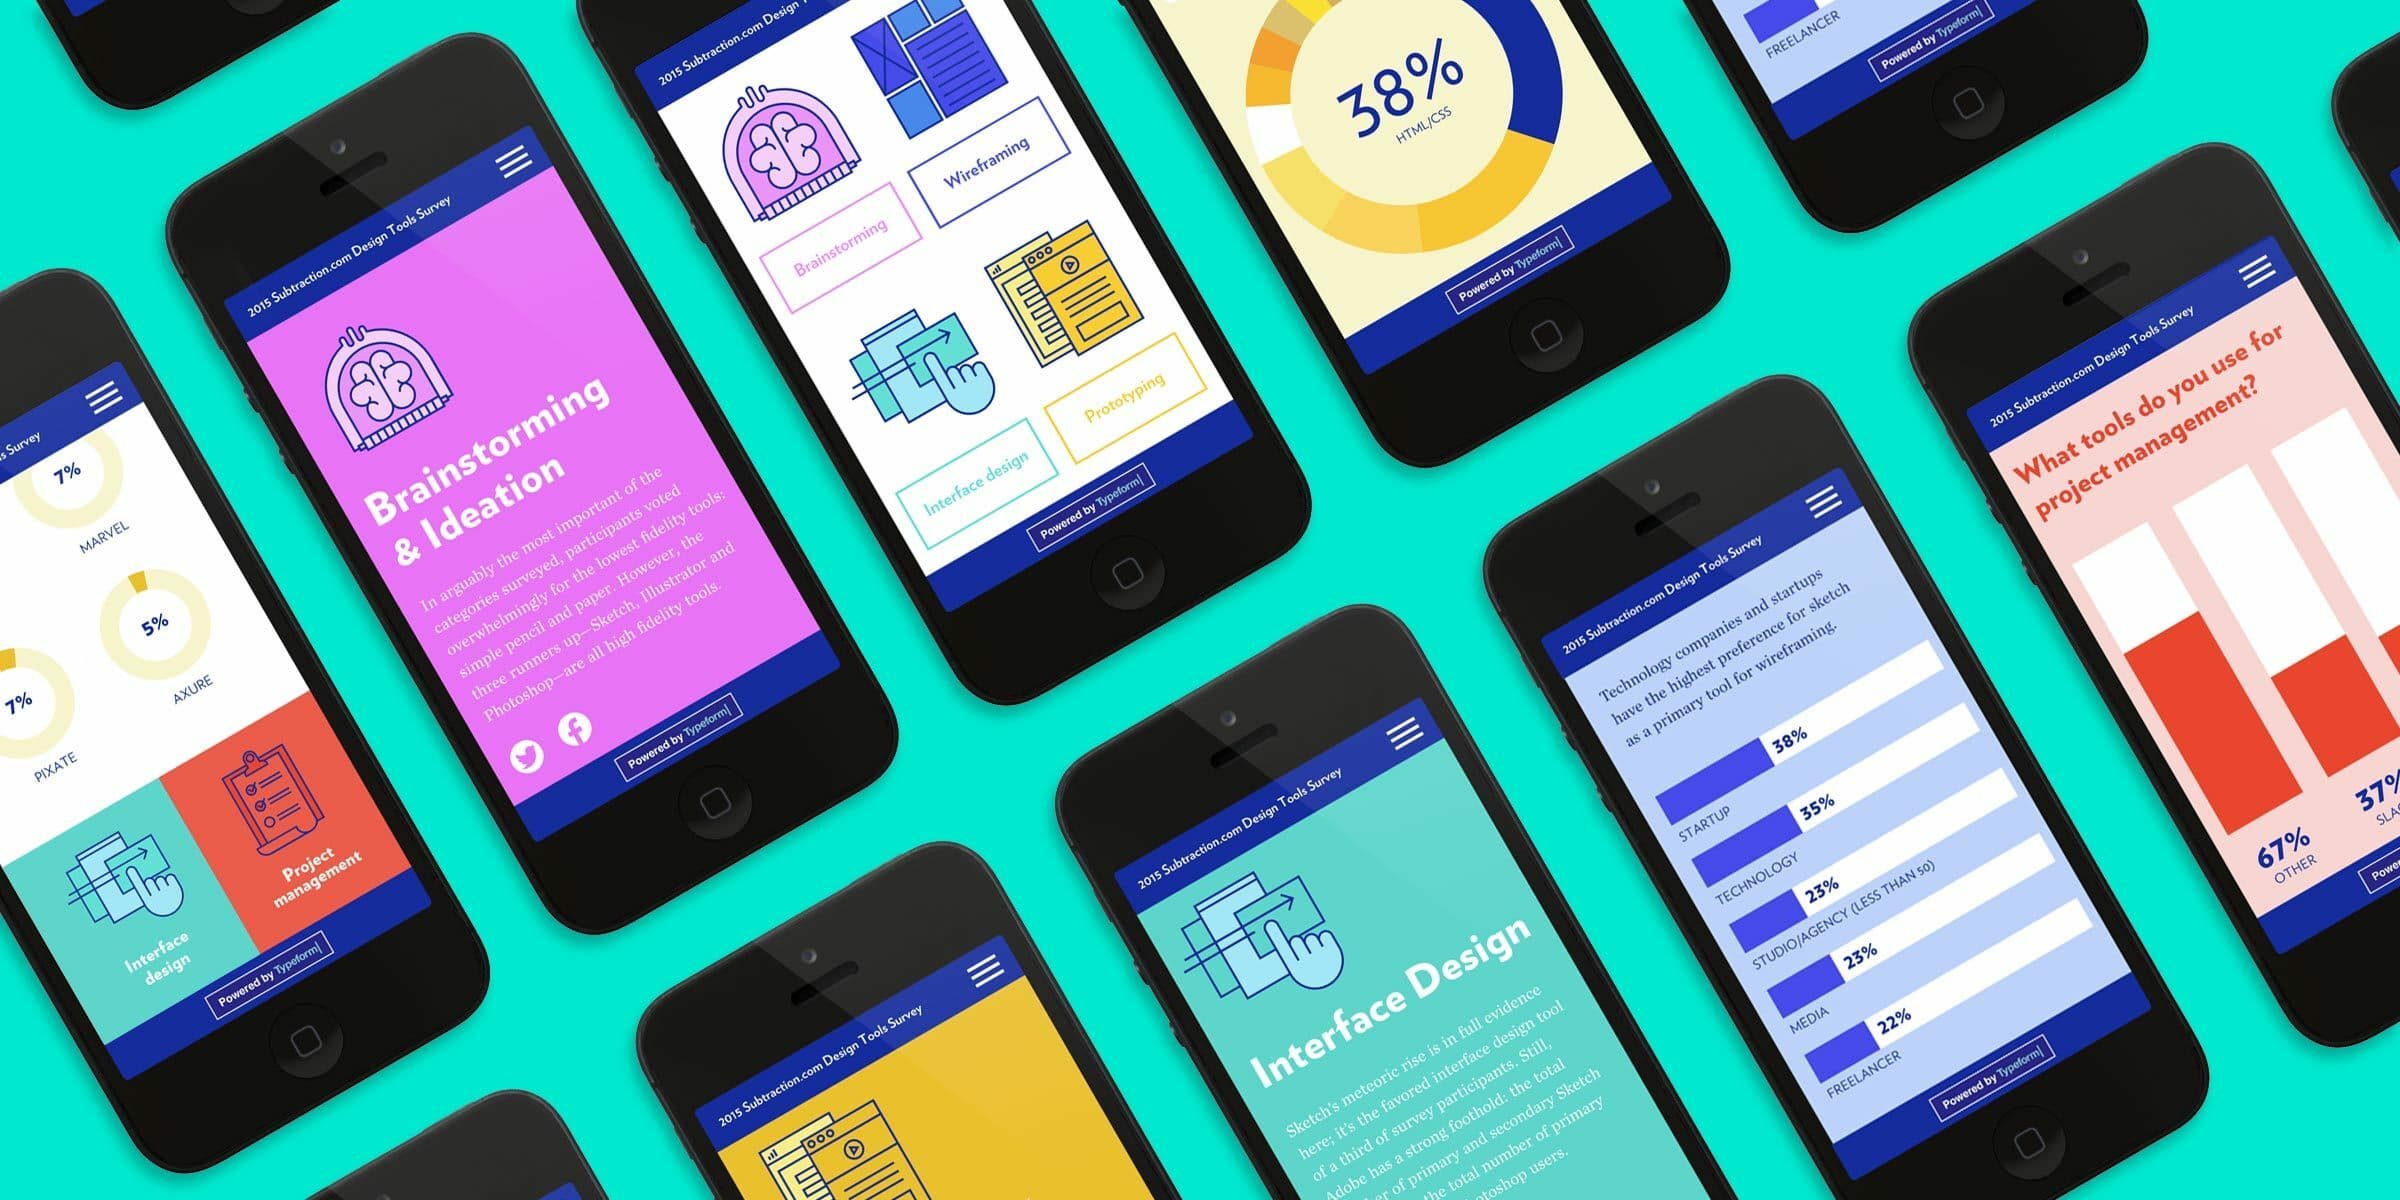
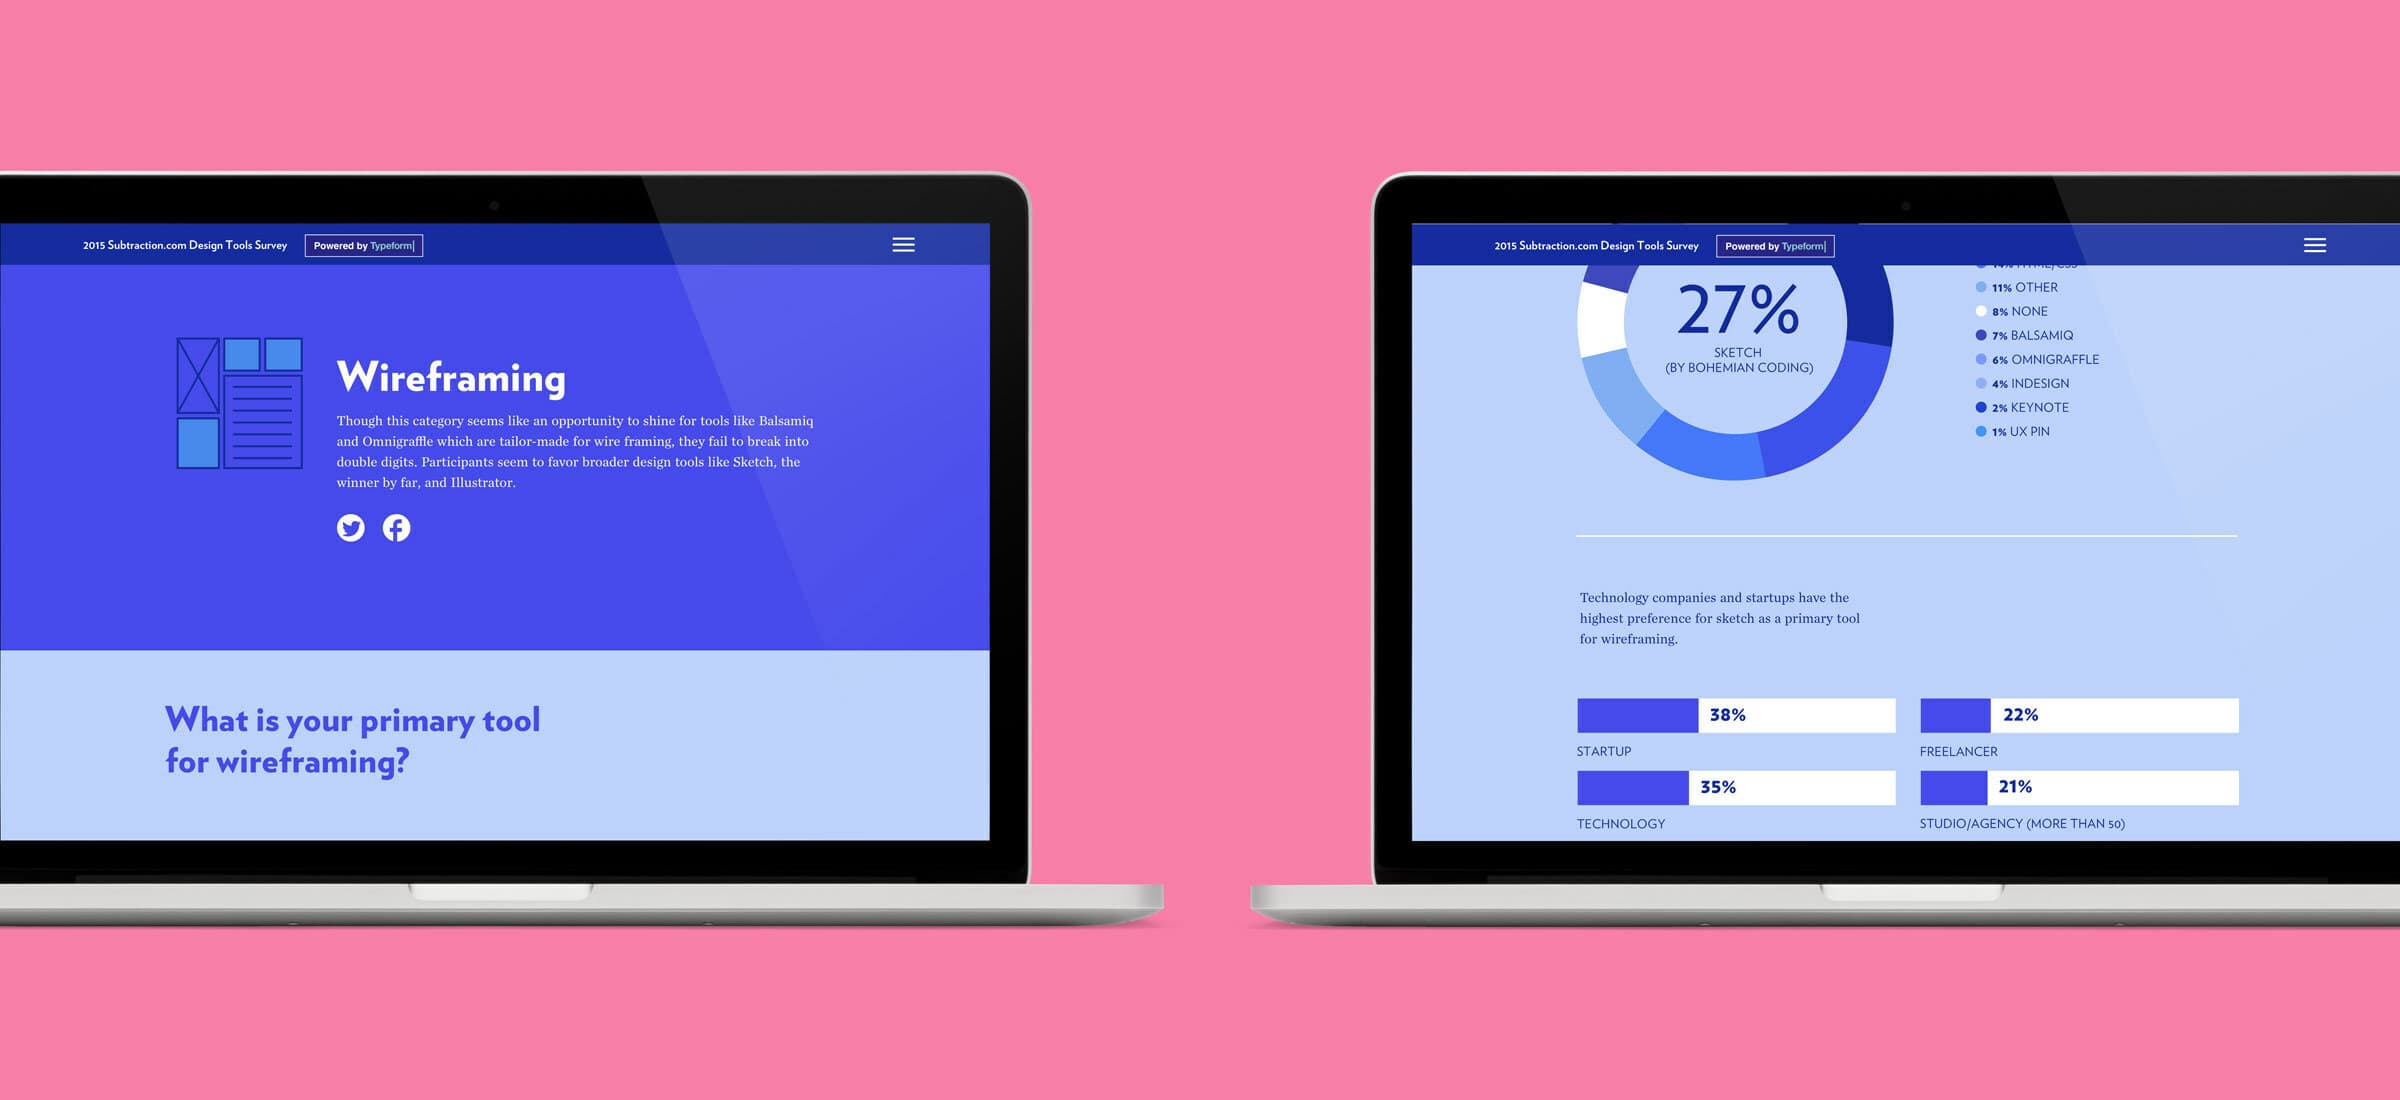
With the flood of new apps, Subtraction asked over 4,000 designers and developers what tools they preferred in 2015 for different tasks in the design process.

Blue illustration with various icons including a camera with an eye, a diamond on paper, a hand clicking a button, an envelope, a brain, a scroll with a pencil, and a window with a play button. The icons are all outlined and set against a blue background.

The Ultimate Designer’s Toolbox is the first in an annual survey by Subtraction. Some tasks had clear winners while others had surprising answers. An analysis of the answers highlighted interesting differences between location, platforms and types of companies. In the end, the site is a great resource to find the best tool for the job.

A desktop computer, laptop, tablet, and smartphone display various pages of a design tool survey website. The desktop screen reads "The ultimate designer's toolbox," while the other devices show additional sections about prototyping and project management.
Illustration of a brain inside a dome-shaped structure, symbolizing brainstorming and ideation. The background is solid pink, and the text "Brainstorming & Ideation" is written below the illustration in white.
A minimalist illustration on a blue background labeled "Wireframing." It features a simple wireframe layout with rectangles and squares representing various design elements.
A turquoise background with a minimalist line art illustration showing a hand touching a screen, overlaid with layers of screens or interfaces, indicating interaction and design. The text "Interface design" appears below the illustration.
Illustration of two overlapping webpage designs, one showing text lines and the other with a play button icon, against a yellow background. The word "Prototyping" is centered beneath the images, indicating the concept of creating preliminary models of web pages.
A graphic showing a line drawing of a folder with an eye symbol on it, representing oversight, placed over icons of a browser window and an envelope. The background is a coral color. Below the graphic, there is text reading "Version control & File management".
A minimalist illustration of a clipboard with a checklist showing two checked items and one unchecked item. The clipboard is outlined in blue against a coral background. The text "Project management" is written below in white.
Illustration on an orange background depicting a blue and white compass with a central map pin, symbolizing the location of participants. White text below reads "Location of participants.
A minimalist blue illustration features three overlapping elements: a desktop monitor with text, a smartphone, and a long paper scroll with text. The word "Platform" is written below the illustration. The background is solid blue.
Illustration of a building combined with a keyboard and a hand pointing upward with a plant sprout from the finger. The image is outlined in blue on an orange background with the text "Type of company" below.
A blue background features an icon of a web browser with a diamond symbol, a rolled-up document, and a pencil. The word "Home" is written below the icon in white text.
The image shows a computer monitor and a laptop, each displaying survey results and discussion topics on a pink background. The monitor highlights percentage data for five countries, while the laptop screen features information on brainstorming and ideation.
Two tablets display survey results. The left tablet shows a bar chart detailing the tools used for project management, with responses in percentages, Adobe, Sketch, InVision, Framer, and Marvel. The right tablet shows a pie chart highlighting InVision as the primary tool for prototyping at 38%, along with a bar chart of other tools and their use percentages.
Two side-by-side laptops display a survey on version control and file management tools. The left screen reads "Version control & File management," while the right screen shows a bar chart with percentages: Git (51%), Dropbox (39%), Google Drive (30%), none (28%), local (12%), and other (11%).
A series of smartphones displayed on a turquoise background, each screen showing various colorful graphic design elements, charts, and icons. The screens include text titles such as "Brainstorming & Ideation," "Interface Design," and various percentage data charts.
Two laptops displaying different screens. The left screen is titled "Wireframing" with descriptive text on a blue background. The right screen shows a survey result pie chart titled "27% Participating Sections," segmented into various categories with percentages. Both laptops are on a pink background.

Project Credits

Year of Completion
Project Team
  • Deroy Peraza
  • Wen Ping Huang
  • Jason Lynch
  • Radhika Unnikrishnan
  • Eric Wang
Ready to unlock the potential of your nonprofit's brand?
Reach Out