Work

Malala Fund: What Works in Girls' Education

The world’s best investment is girls’ education.

A computer monitor and a tablet display a website titled "What Works in Girls' Education" against a bright pink background. The site features vibrant graphics and text promoting high-quality education for girls.

Background

Startlingly, most nations do not have enough resources to give every girl the education they deserve. The Malala Fund and Brookings Institute are committed to efforts that work toward changing this reality. A new book created by the Center for Universal Education at Brookings, “What Works in Girls’ Education,” makes the case that if nations and families invested in girls’ education, it yields such a positive ecosystem of returns, that no girl should be ever be denied an education.

A digital infographic with multiple sections presented in a colorful, modern design. It highlights information on girls' education, featuring photos of girls and graphics depicting statistics related to education crises. The infographic has icons, charts, and blocks of text.

The challenge

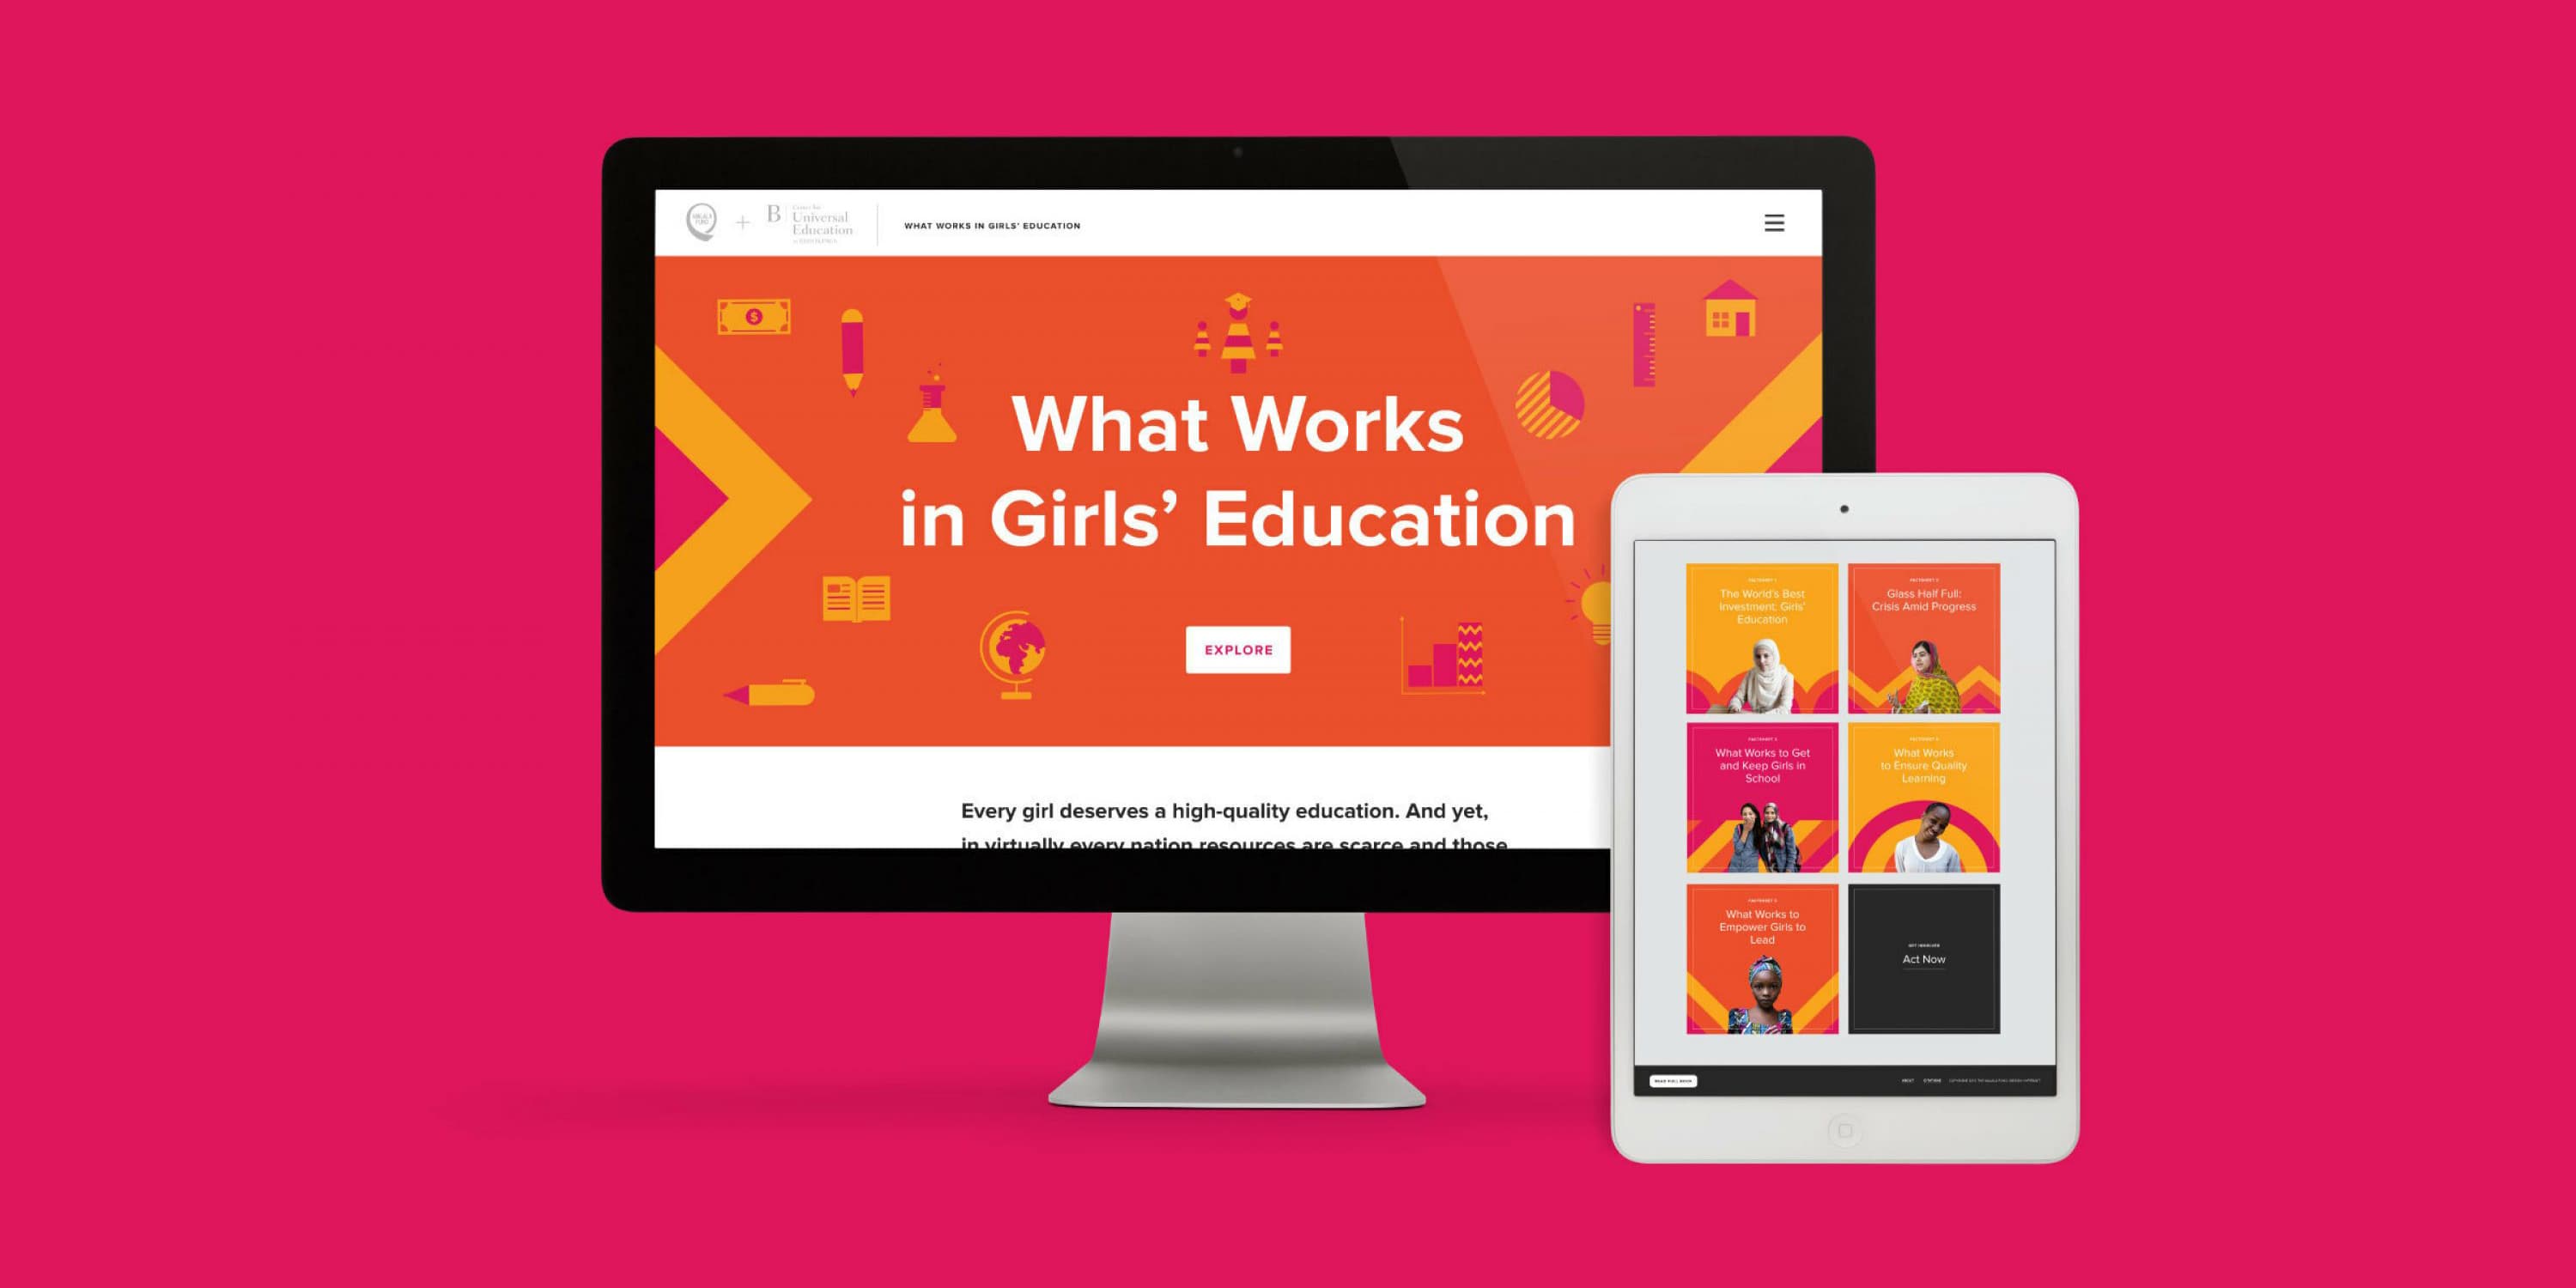
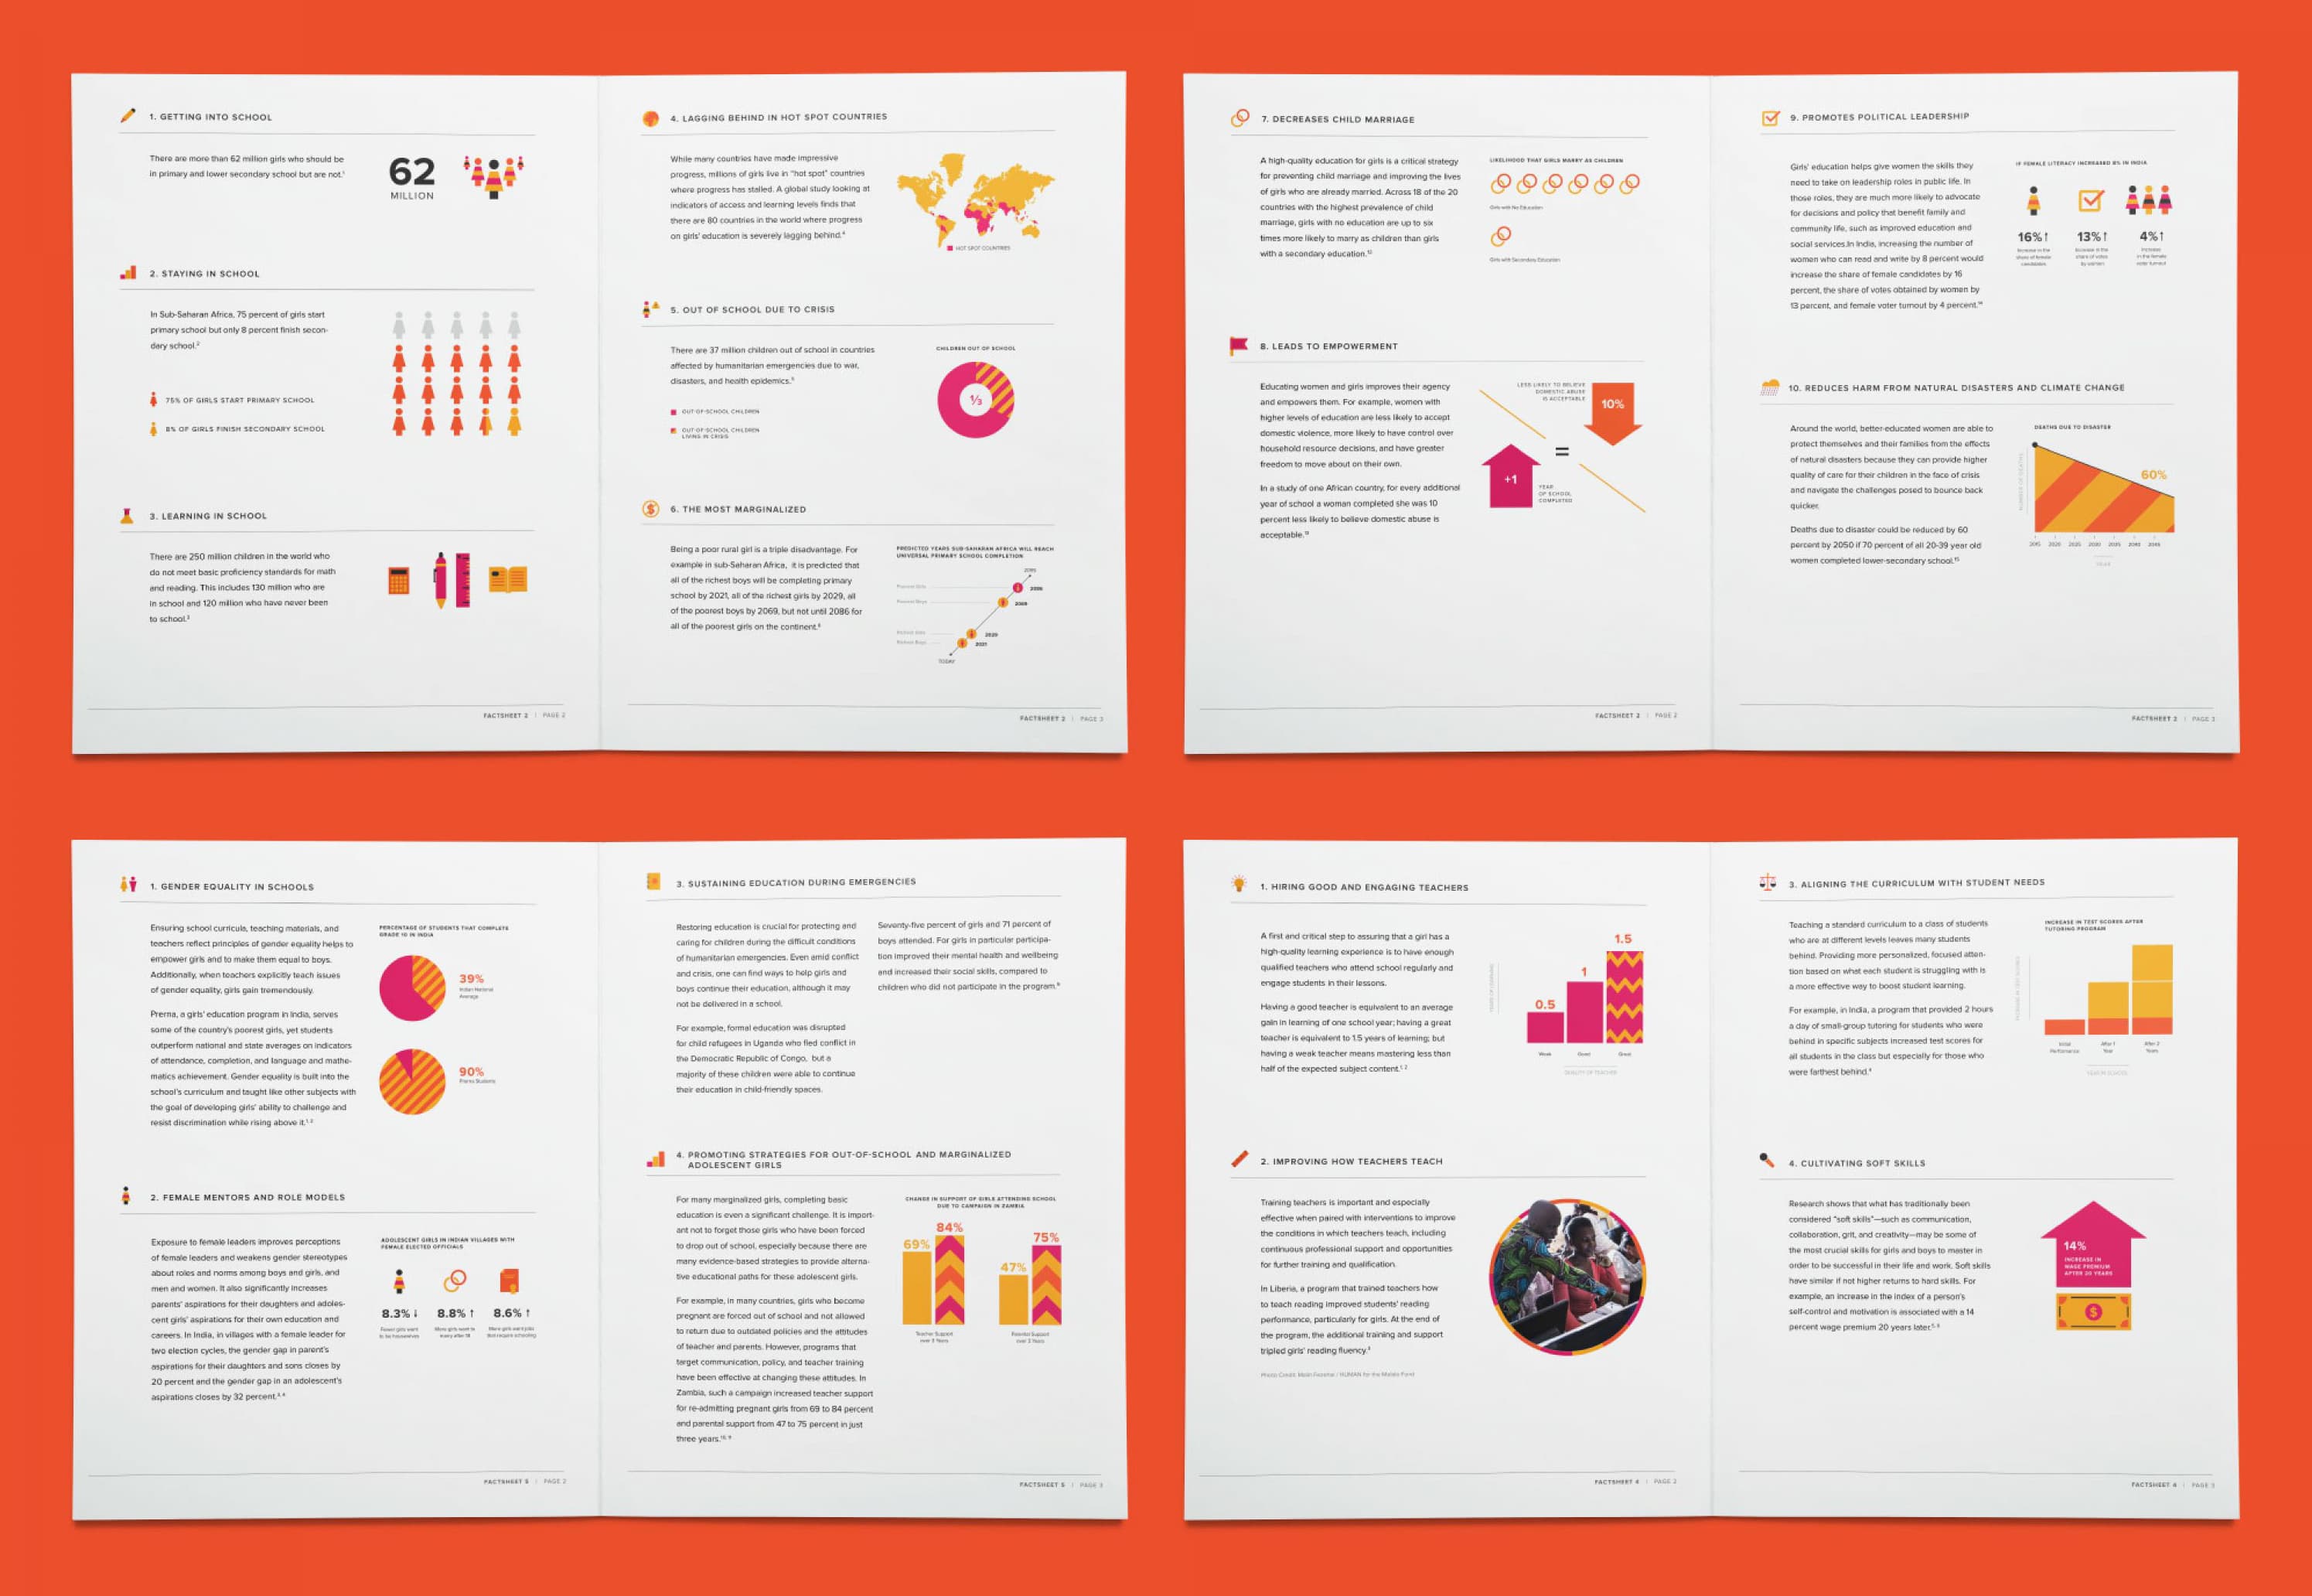
We teamed up with Malala Fund, Brookings Institution, and Carrot Creative’s development team to design the ‘What Works in Girls’ Education microsite. Using the brand framework that the main Malala.org site established with Carrot Creative, we worked to consolidate key points from the book into five easily digestible factsheets. This project challenged us not only to visually communicate dense information in a clear, impactful, and approachable way, but also to create a cohesive platform for the collaboration between these two different organizations.

A collection of colorful school-related icons including a ruler, syringe, rainy cloud, sun, water bottle, certificate, book, pie chart, notebook, calendar, pen, calculator, globe, and a flask with bubbles.
An open magazine with six double-page spreads is displayed against an orange background. The pages feature various infographics, charts, and maps in vibrant colors, alongside text in black, presenting statistical data and information in a visually appealing manner.

The opportunity

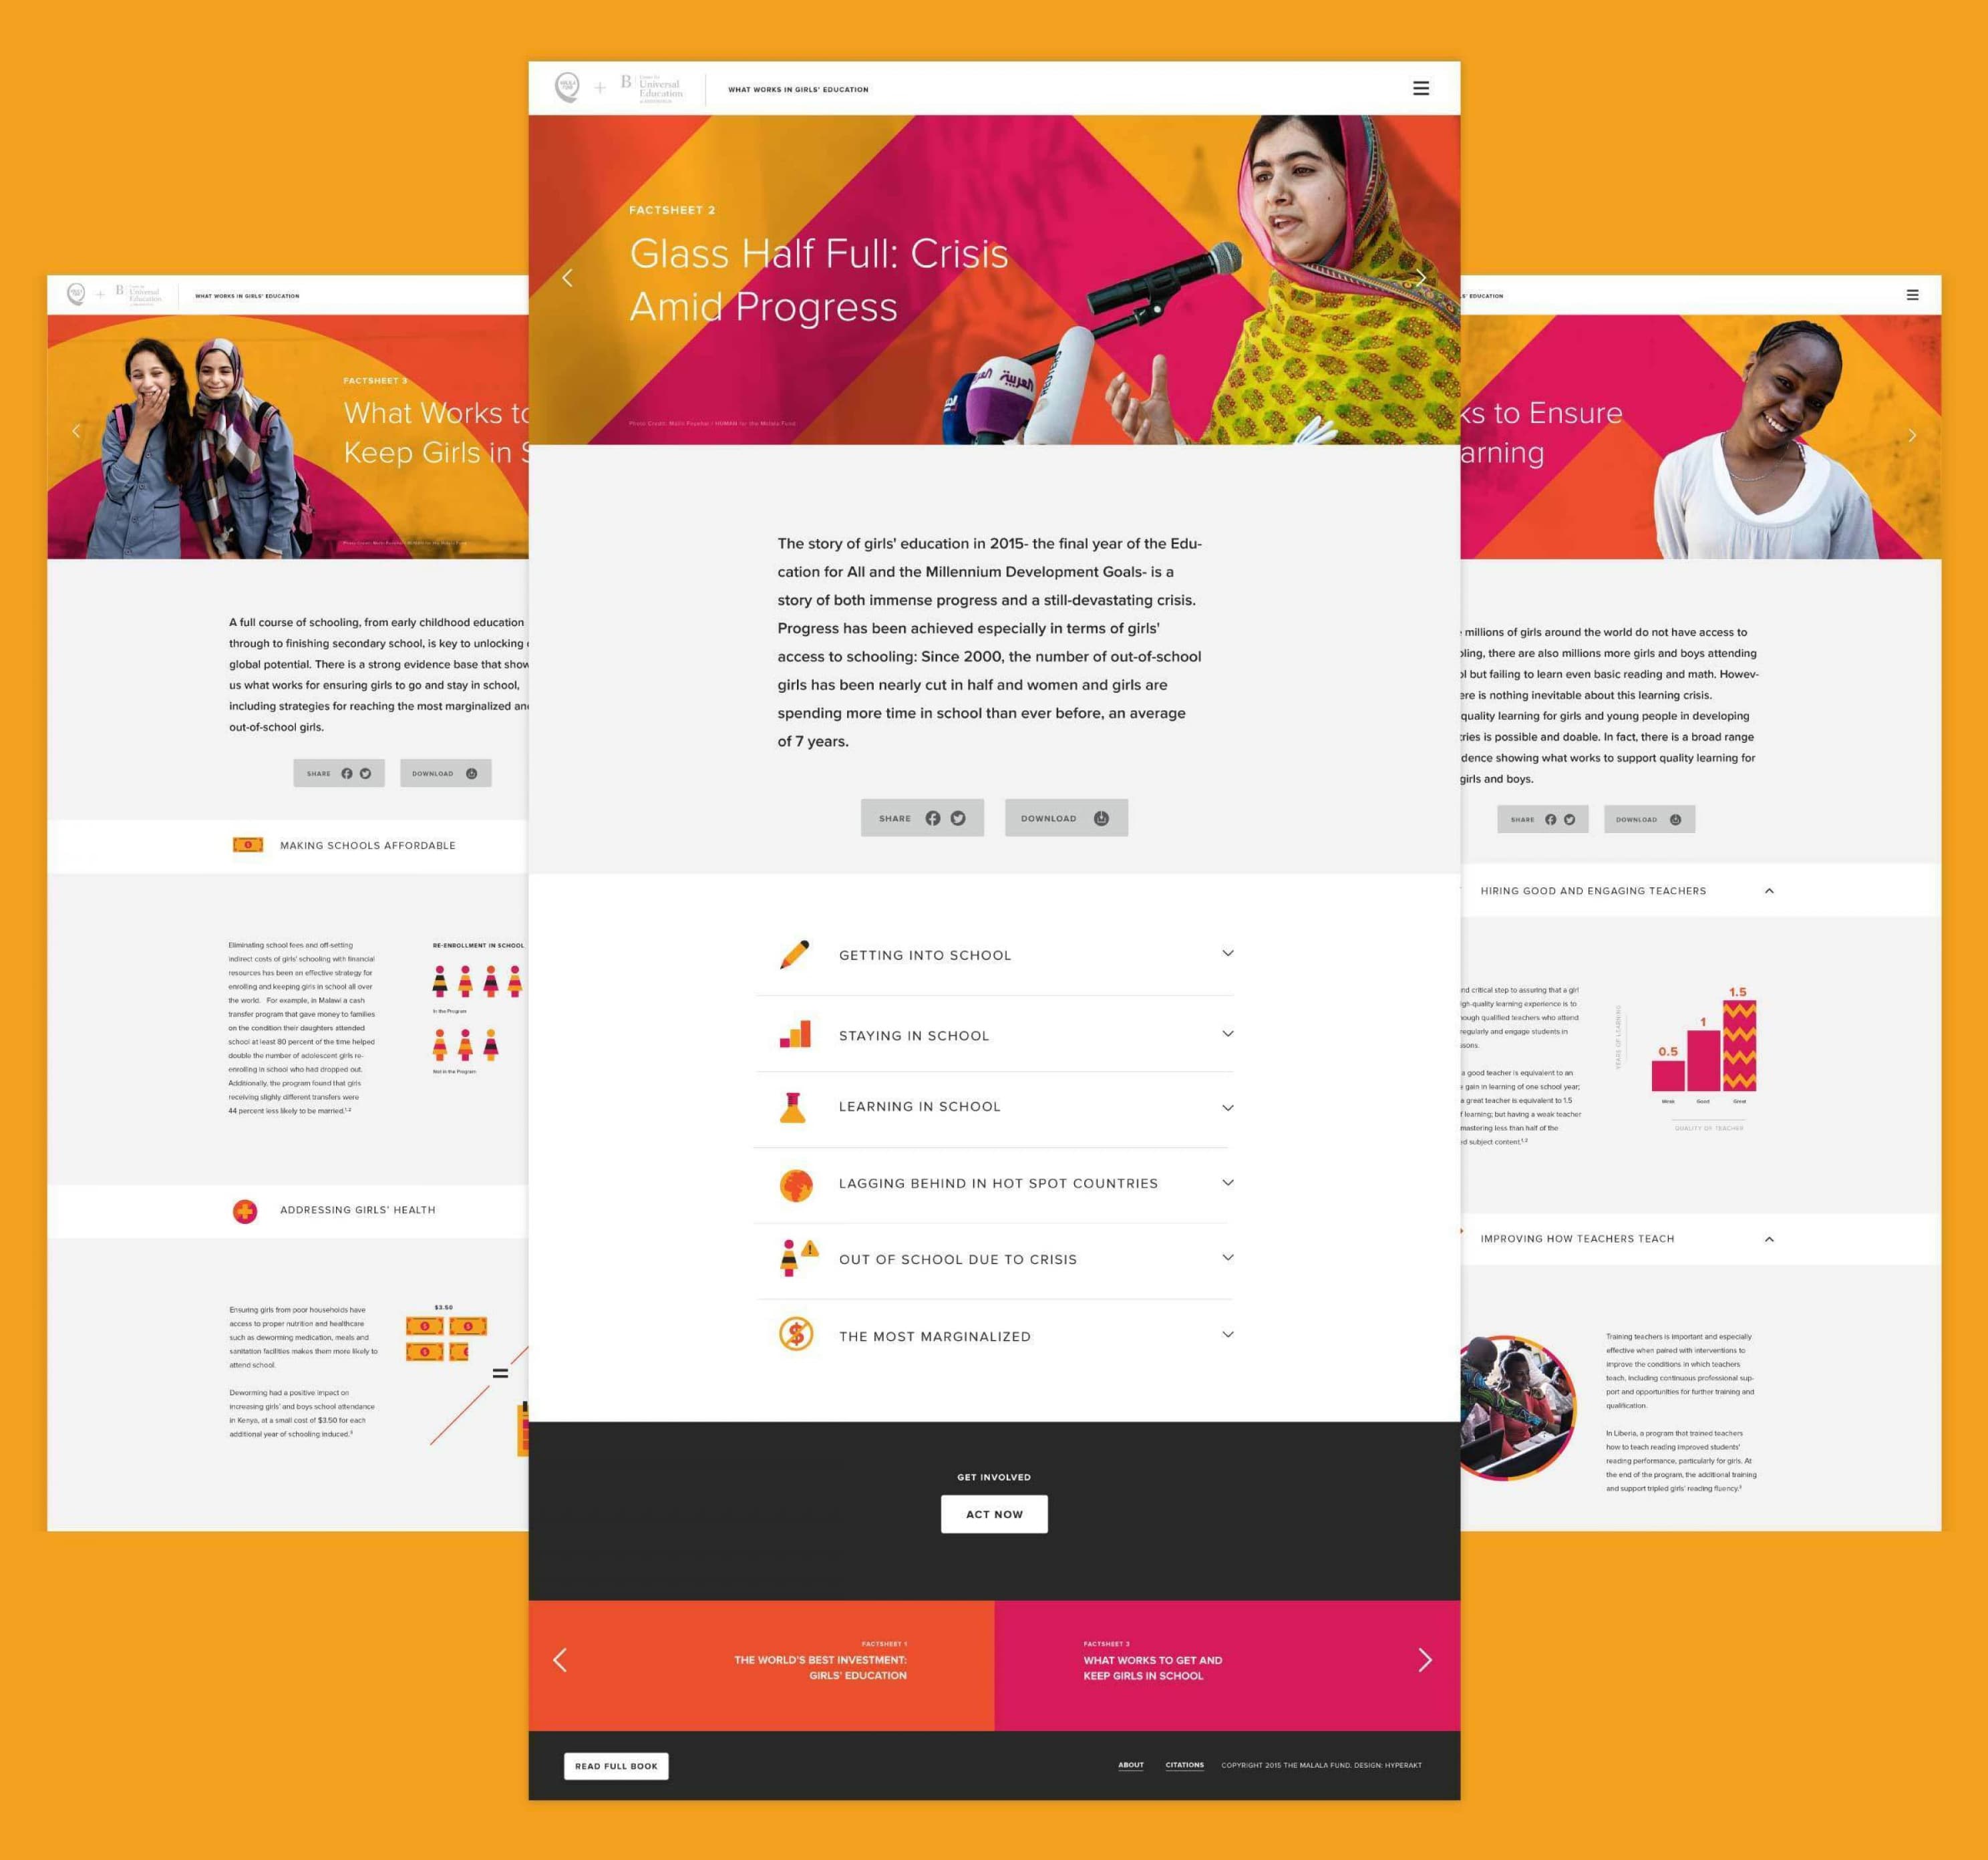
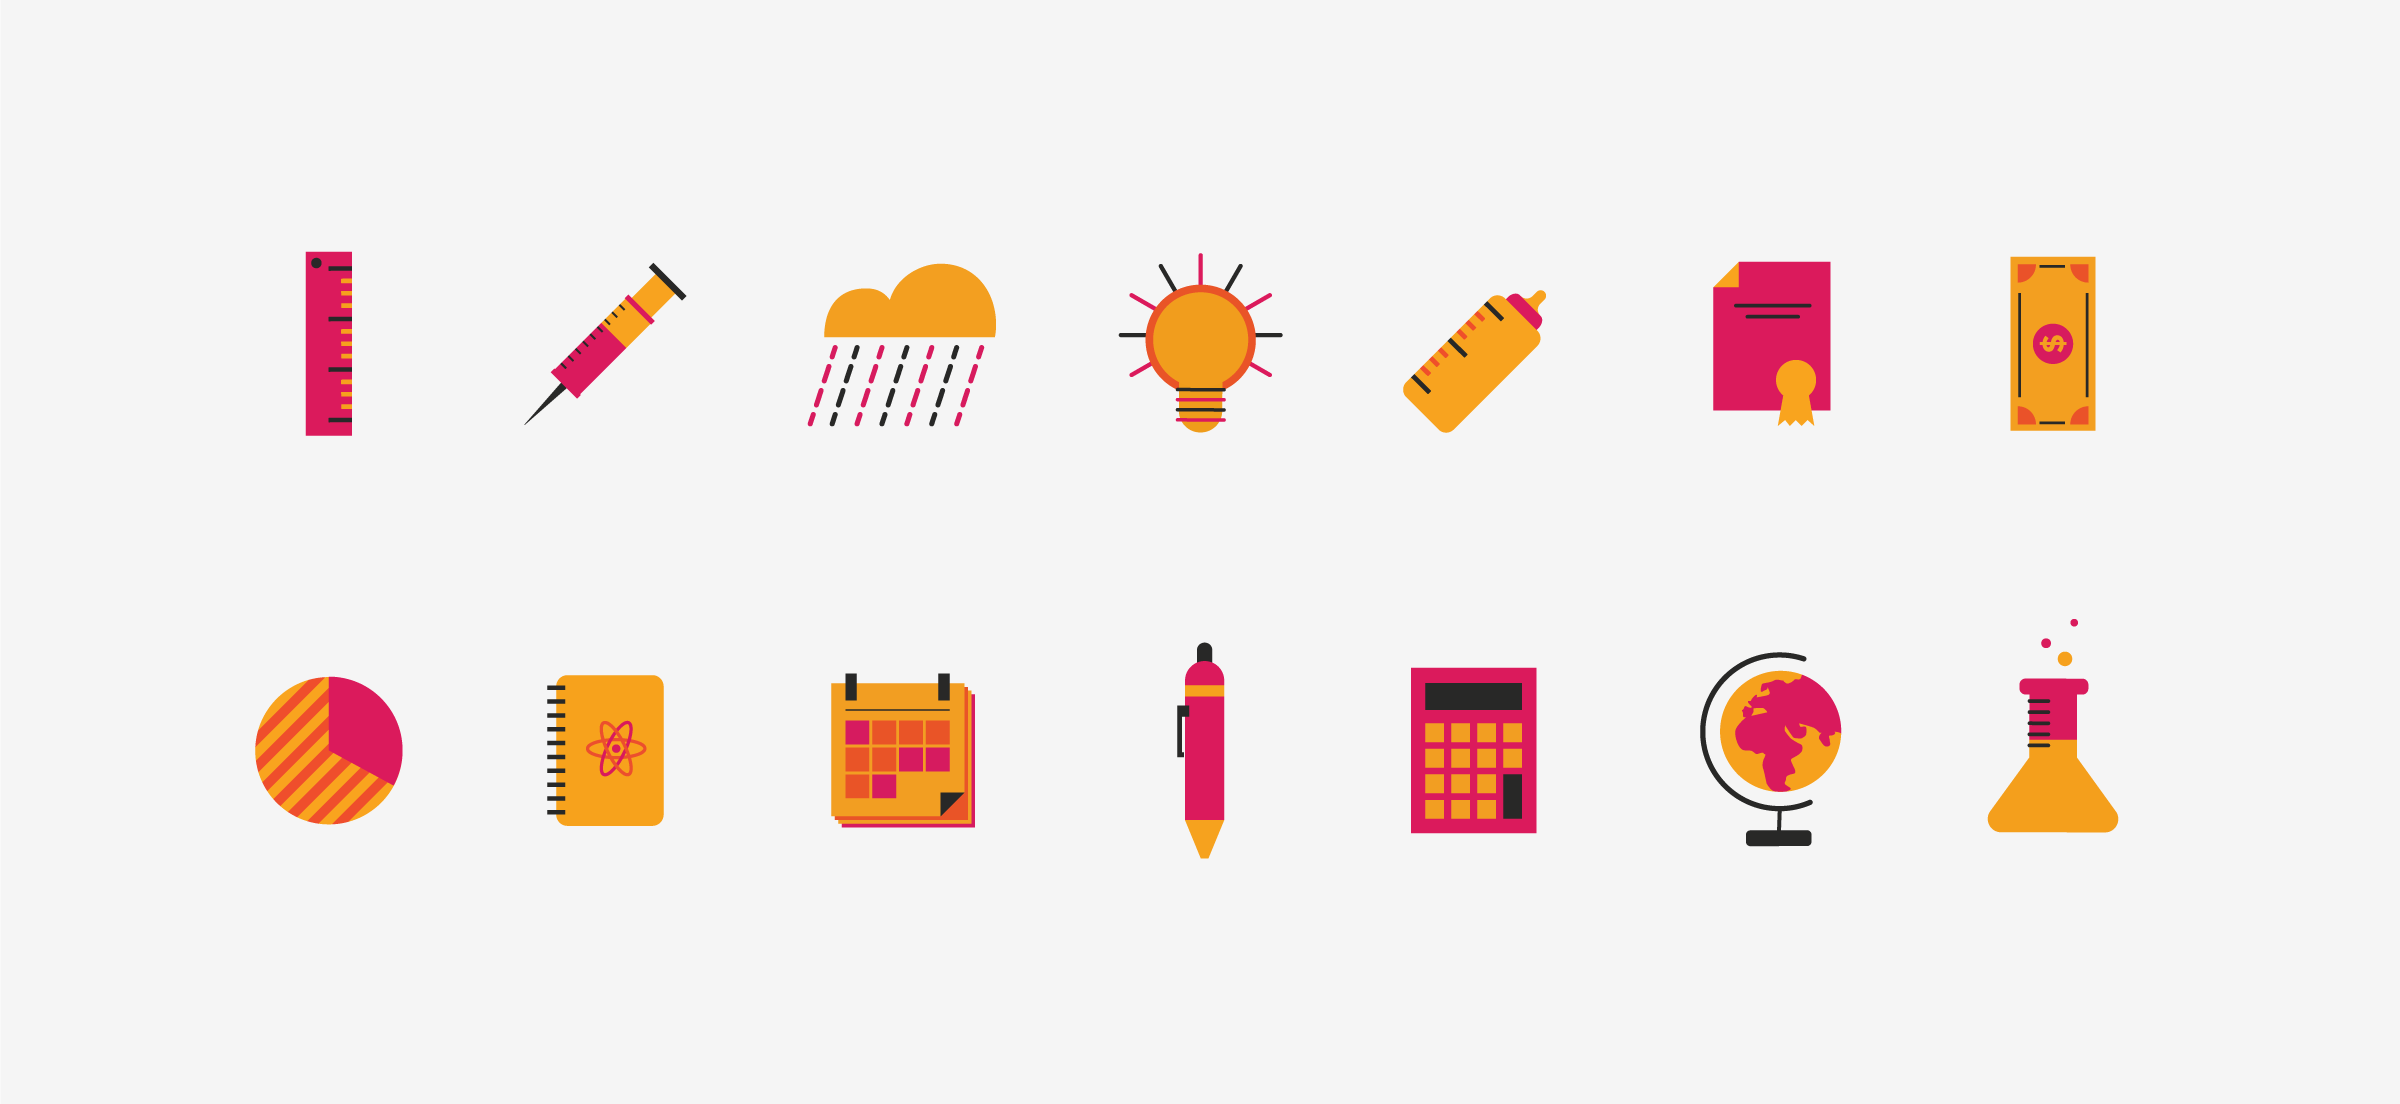
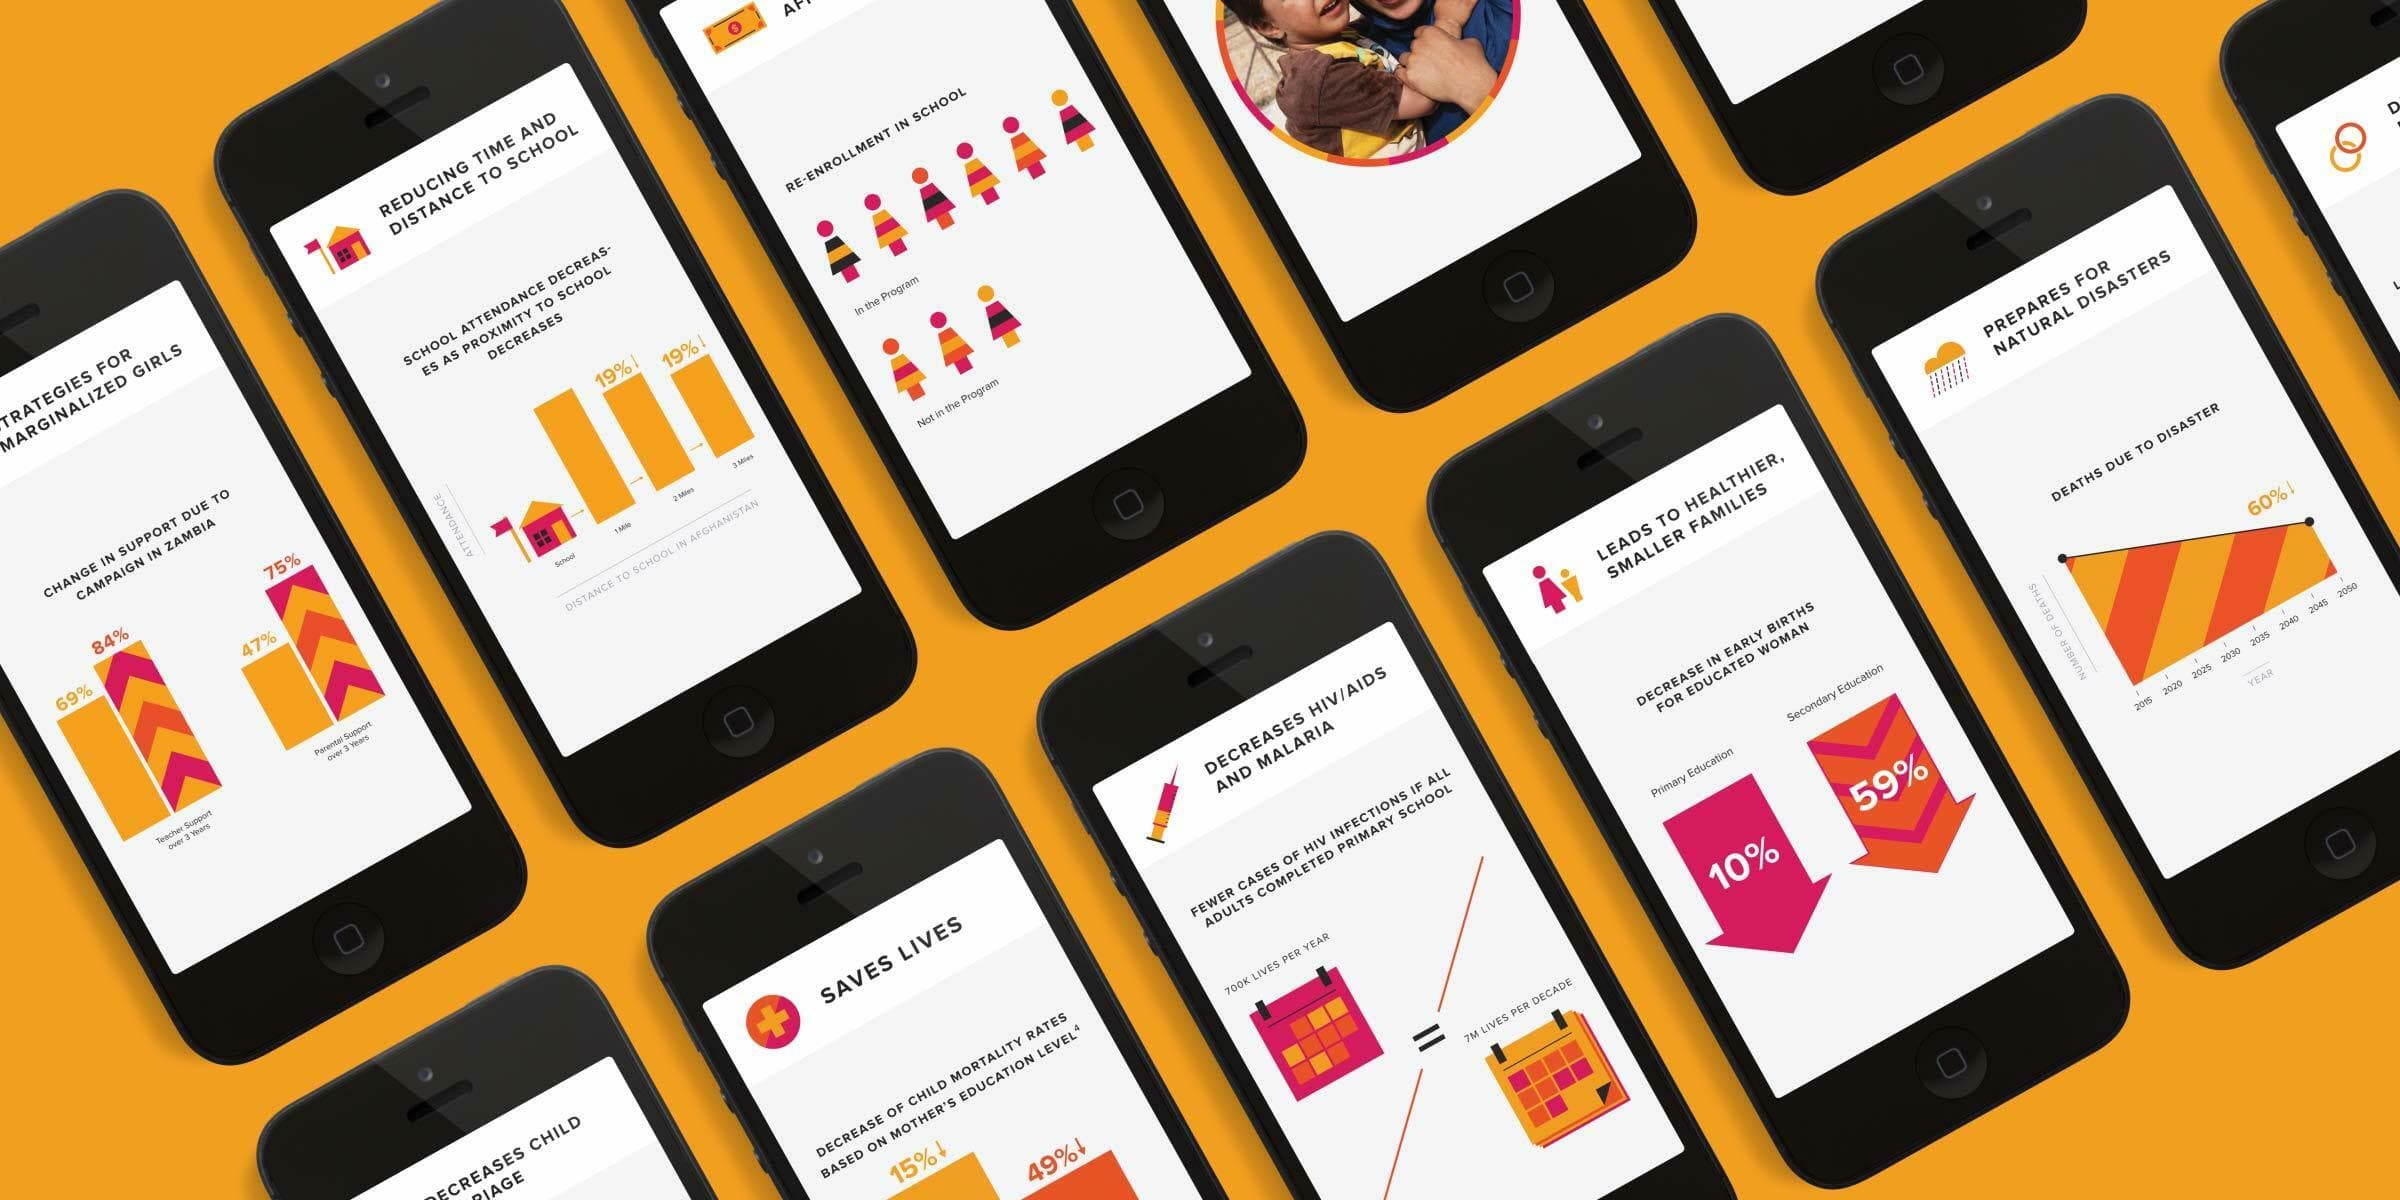
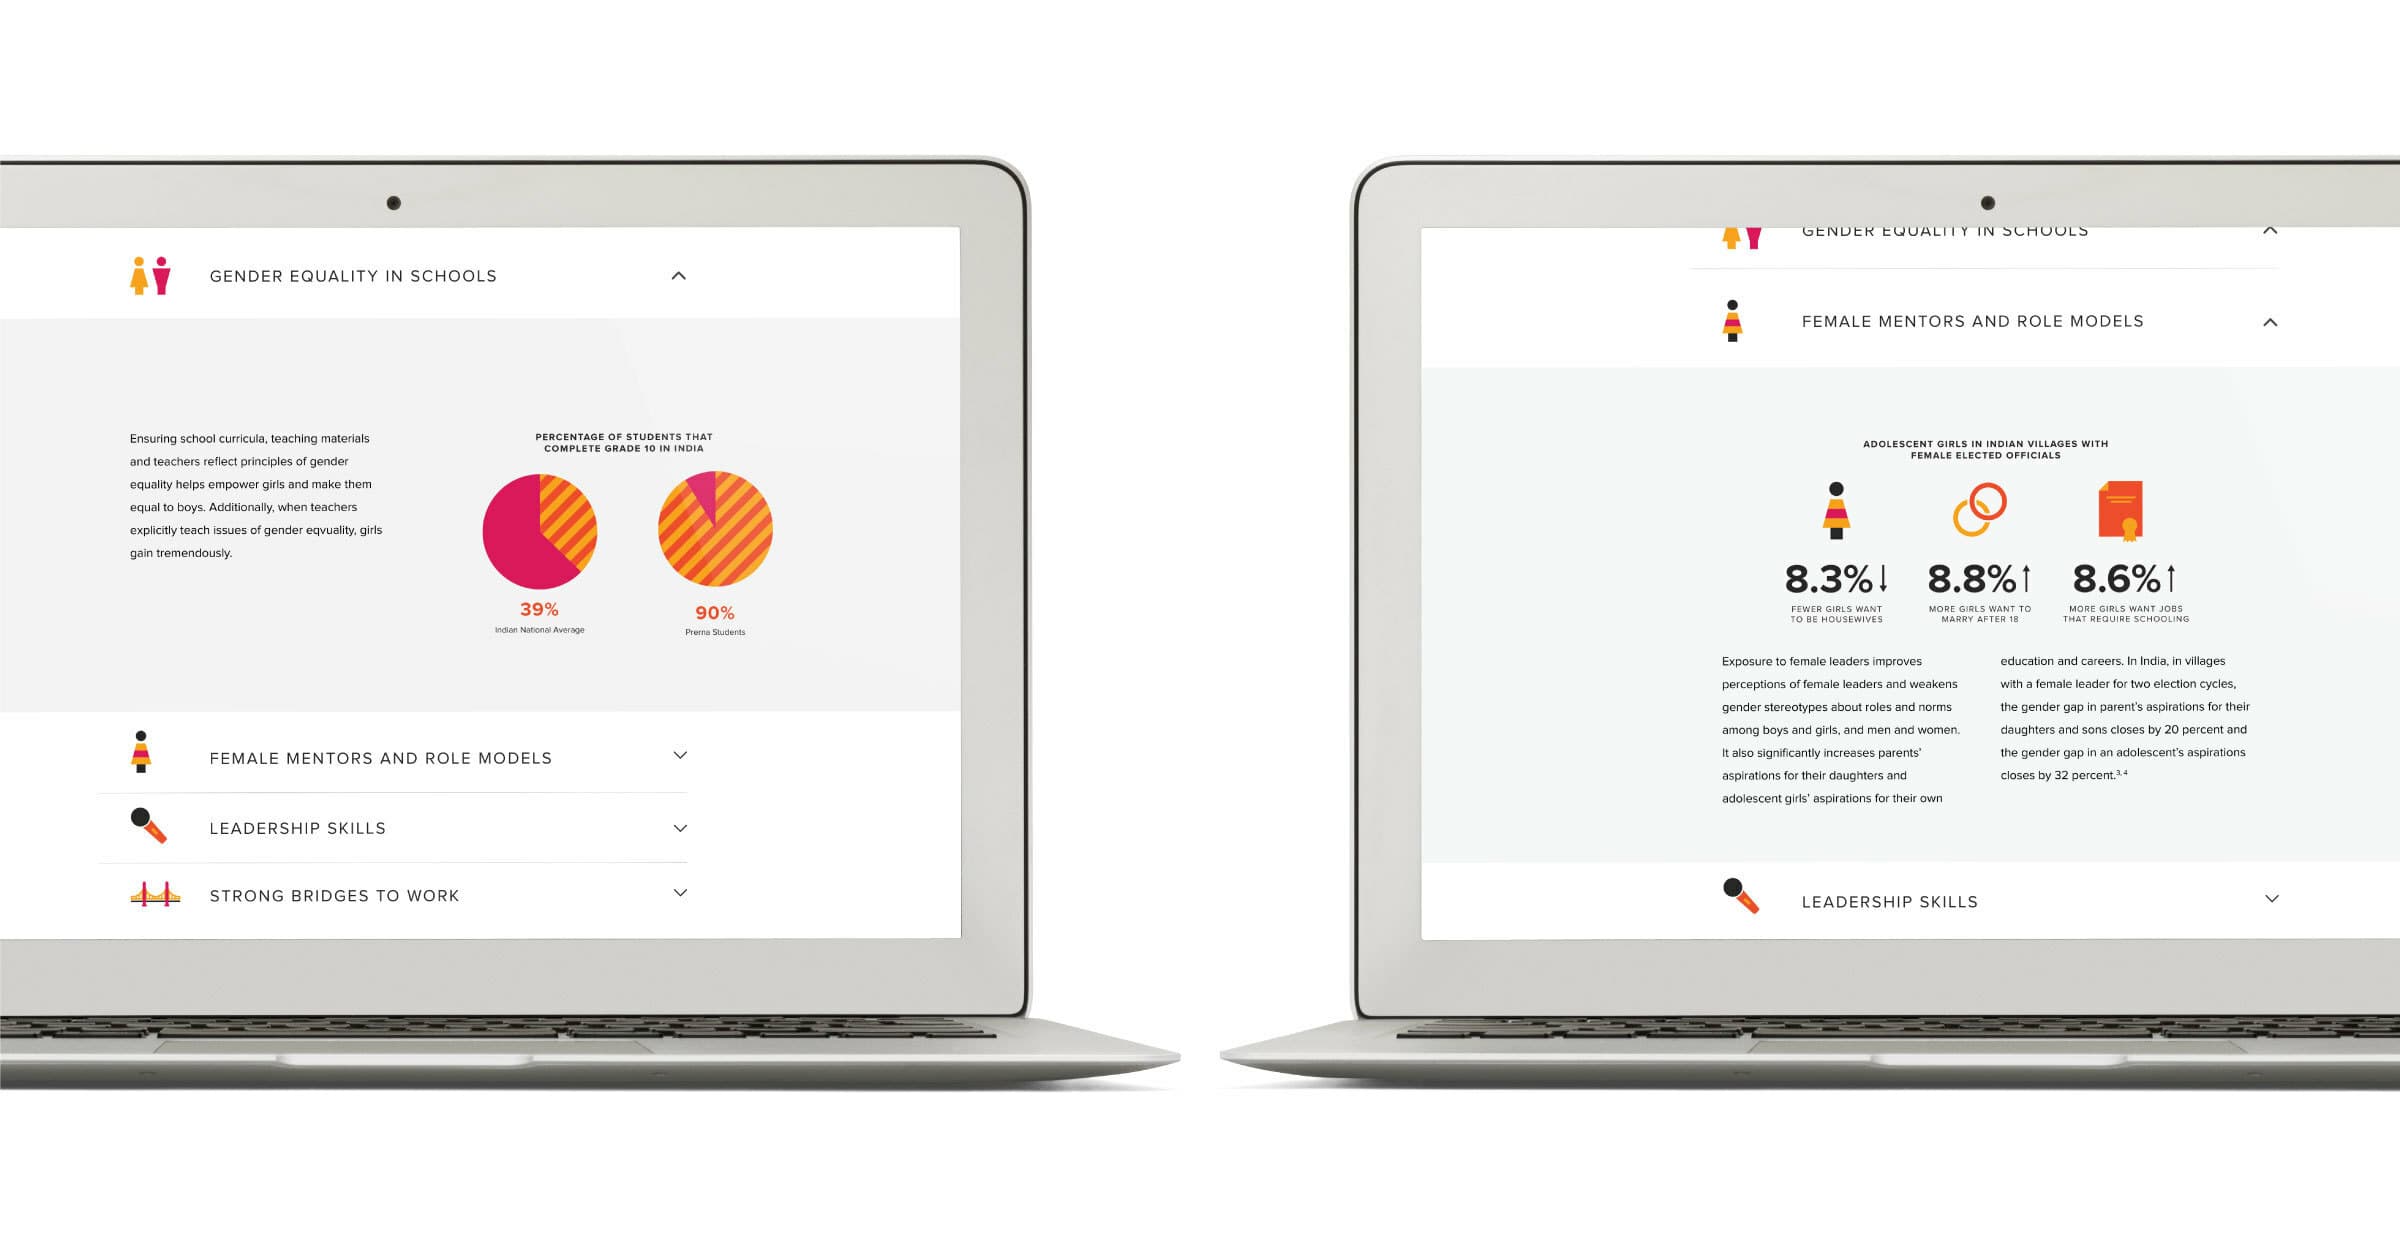
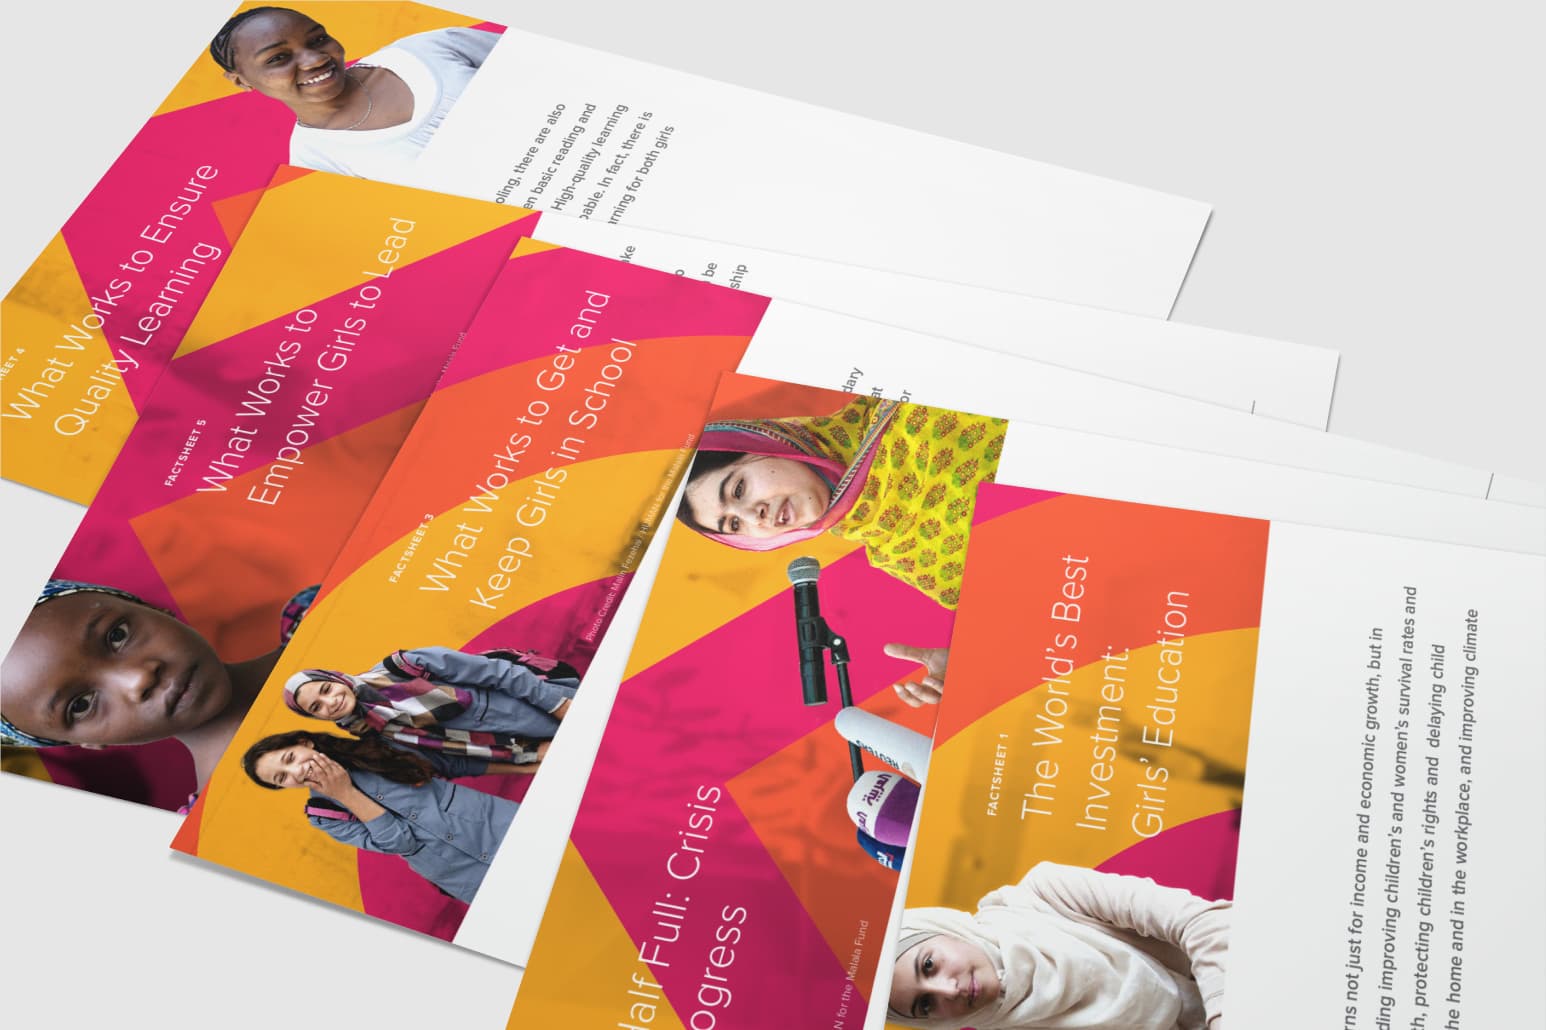
Working with 30 facts and insights from the book, our approach started with creating a wireframe that presented the data points into an organized and accessible interface. This helped the Brookings team understand where the language could be modified to become more web-friendly. Then, by using an iconography wayfinding system, and a friendly user interface, the facts and insights on each factsheet become powerful and easily understood by the reader. Finally, we translated the web factsheets into downloadable print resources.

The image contains four circular photos in a row. The first shows a person in a yellow garment. The second depicts two people in a classroom setting. The third shows a person in colorful clothing teaching a student on a laptop. The fourth shows a person speaking to a group.
A collection of smartphones displaying various colorful charts, graphs, and infographics. The graphics showcase different data visualizations, primarily using orange, yellow, pink, and red colors, against a bright orange background.
The image shows two open laptops side by side. Each laptop screen displays a webpage about gender equality in schools, focusing on female mentors, role models, and leadership skills. The left screen includes a chart with percentages, while the right screen shows statistics and icons.
A set of colorful, overlapping flyers featuring diverse girls and women. Headlines focus on ensuring quality learning, empowering girls, keeping girls in school, and highlighting the global importance of girls' education. Bright and engaging visuals accompany each topic.

Project Credits

Project Team
Ready to unlock the potential of your nonprofit's brand?
Reach Out